For my quantified self assignment I decided to track something that characterizes me as a person in order to create a data driven self portrait. I have always been a morning person, since I was a kid, my mom used to tell stories on how I wouldn’t let her or my dad sleep until late on weekends because I was already up and asking for breakfast since 6 in the morning. This is a characteristic that i have tried to use in my advantage in my adult life because it helps me be more productive and achieve a healthier lifestyle if I’m able to start my days at 6:00 am.
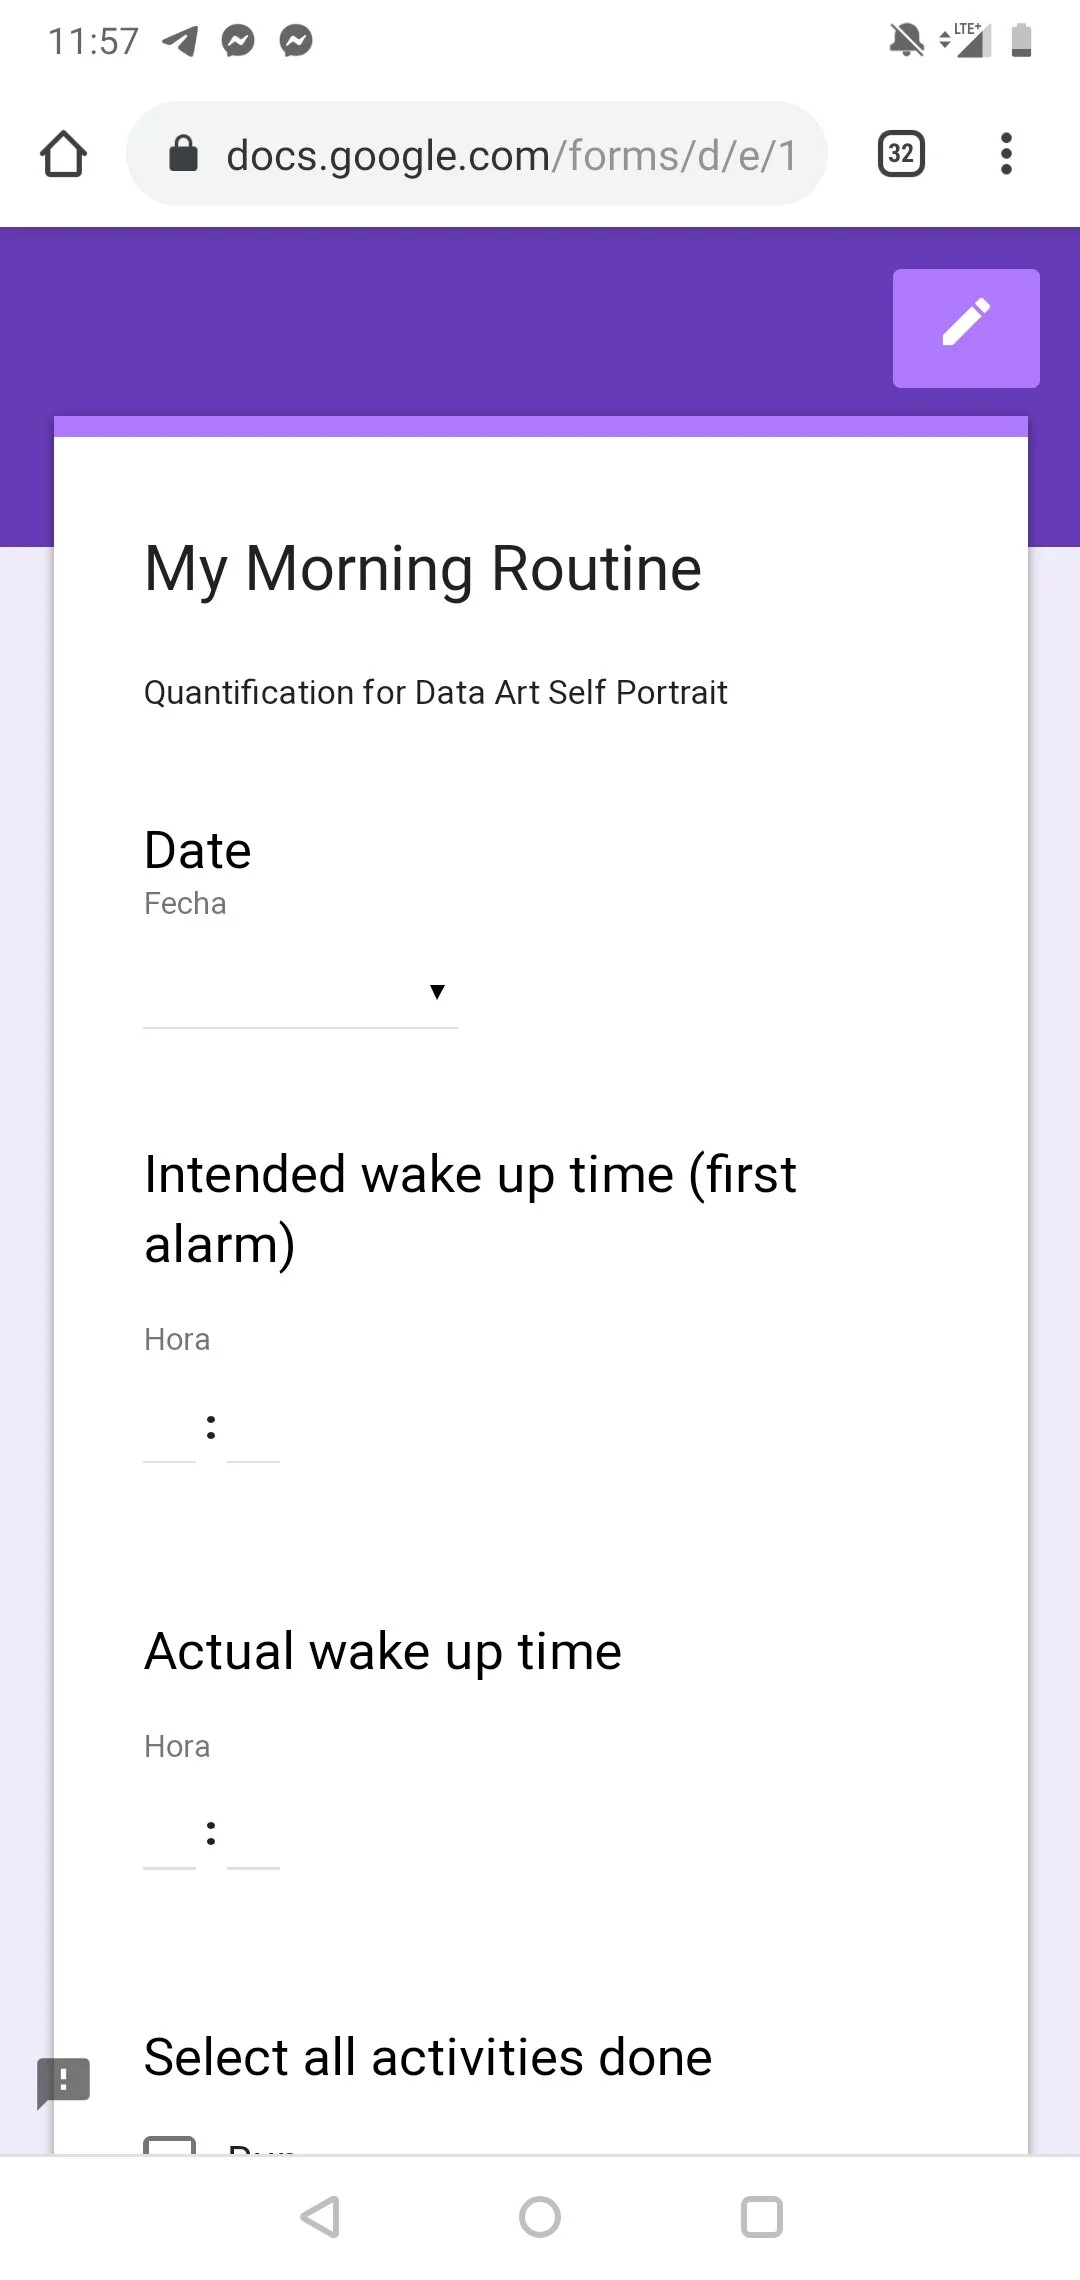
The way that I decided to track myself was by using a Google form, I designed it in a way I would be able to have different data entries, which I would later decide how to use. I collected my intended wake up time and my actual wake up time, all the activities done during the morning (selected with checkboxes), and the time that I arrived to my destination. My intention was to be able to visualize my very productive mornings versus the mornings that I “failed”, for example, on Thursday I intended to wake up at 6:00 am however I snoozed my alarm and woke up at 7:00 am instead, therefore I wasn’t able to go for a run that morning and in my head that counted as a non productive morning. I was particularly curious about how all of this information that I collected was going to look like in a unified graphic.
Mobile phone data collection
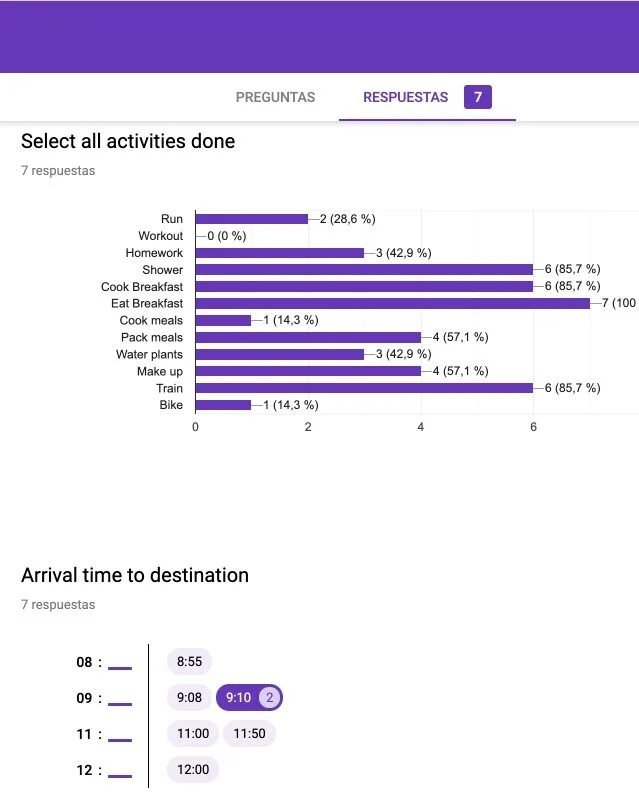
Data Analysis
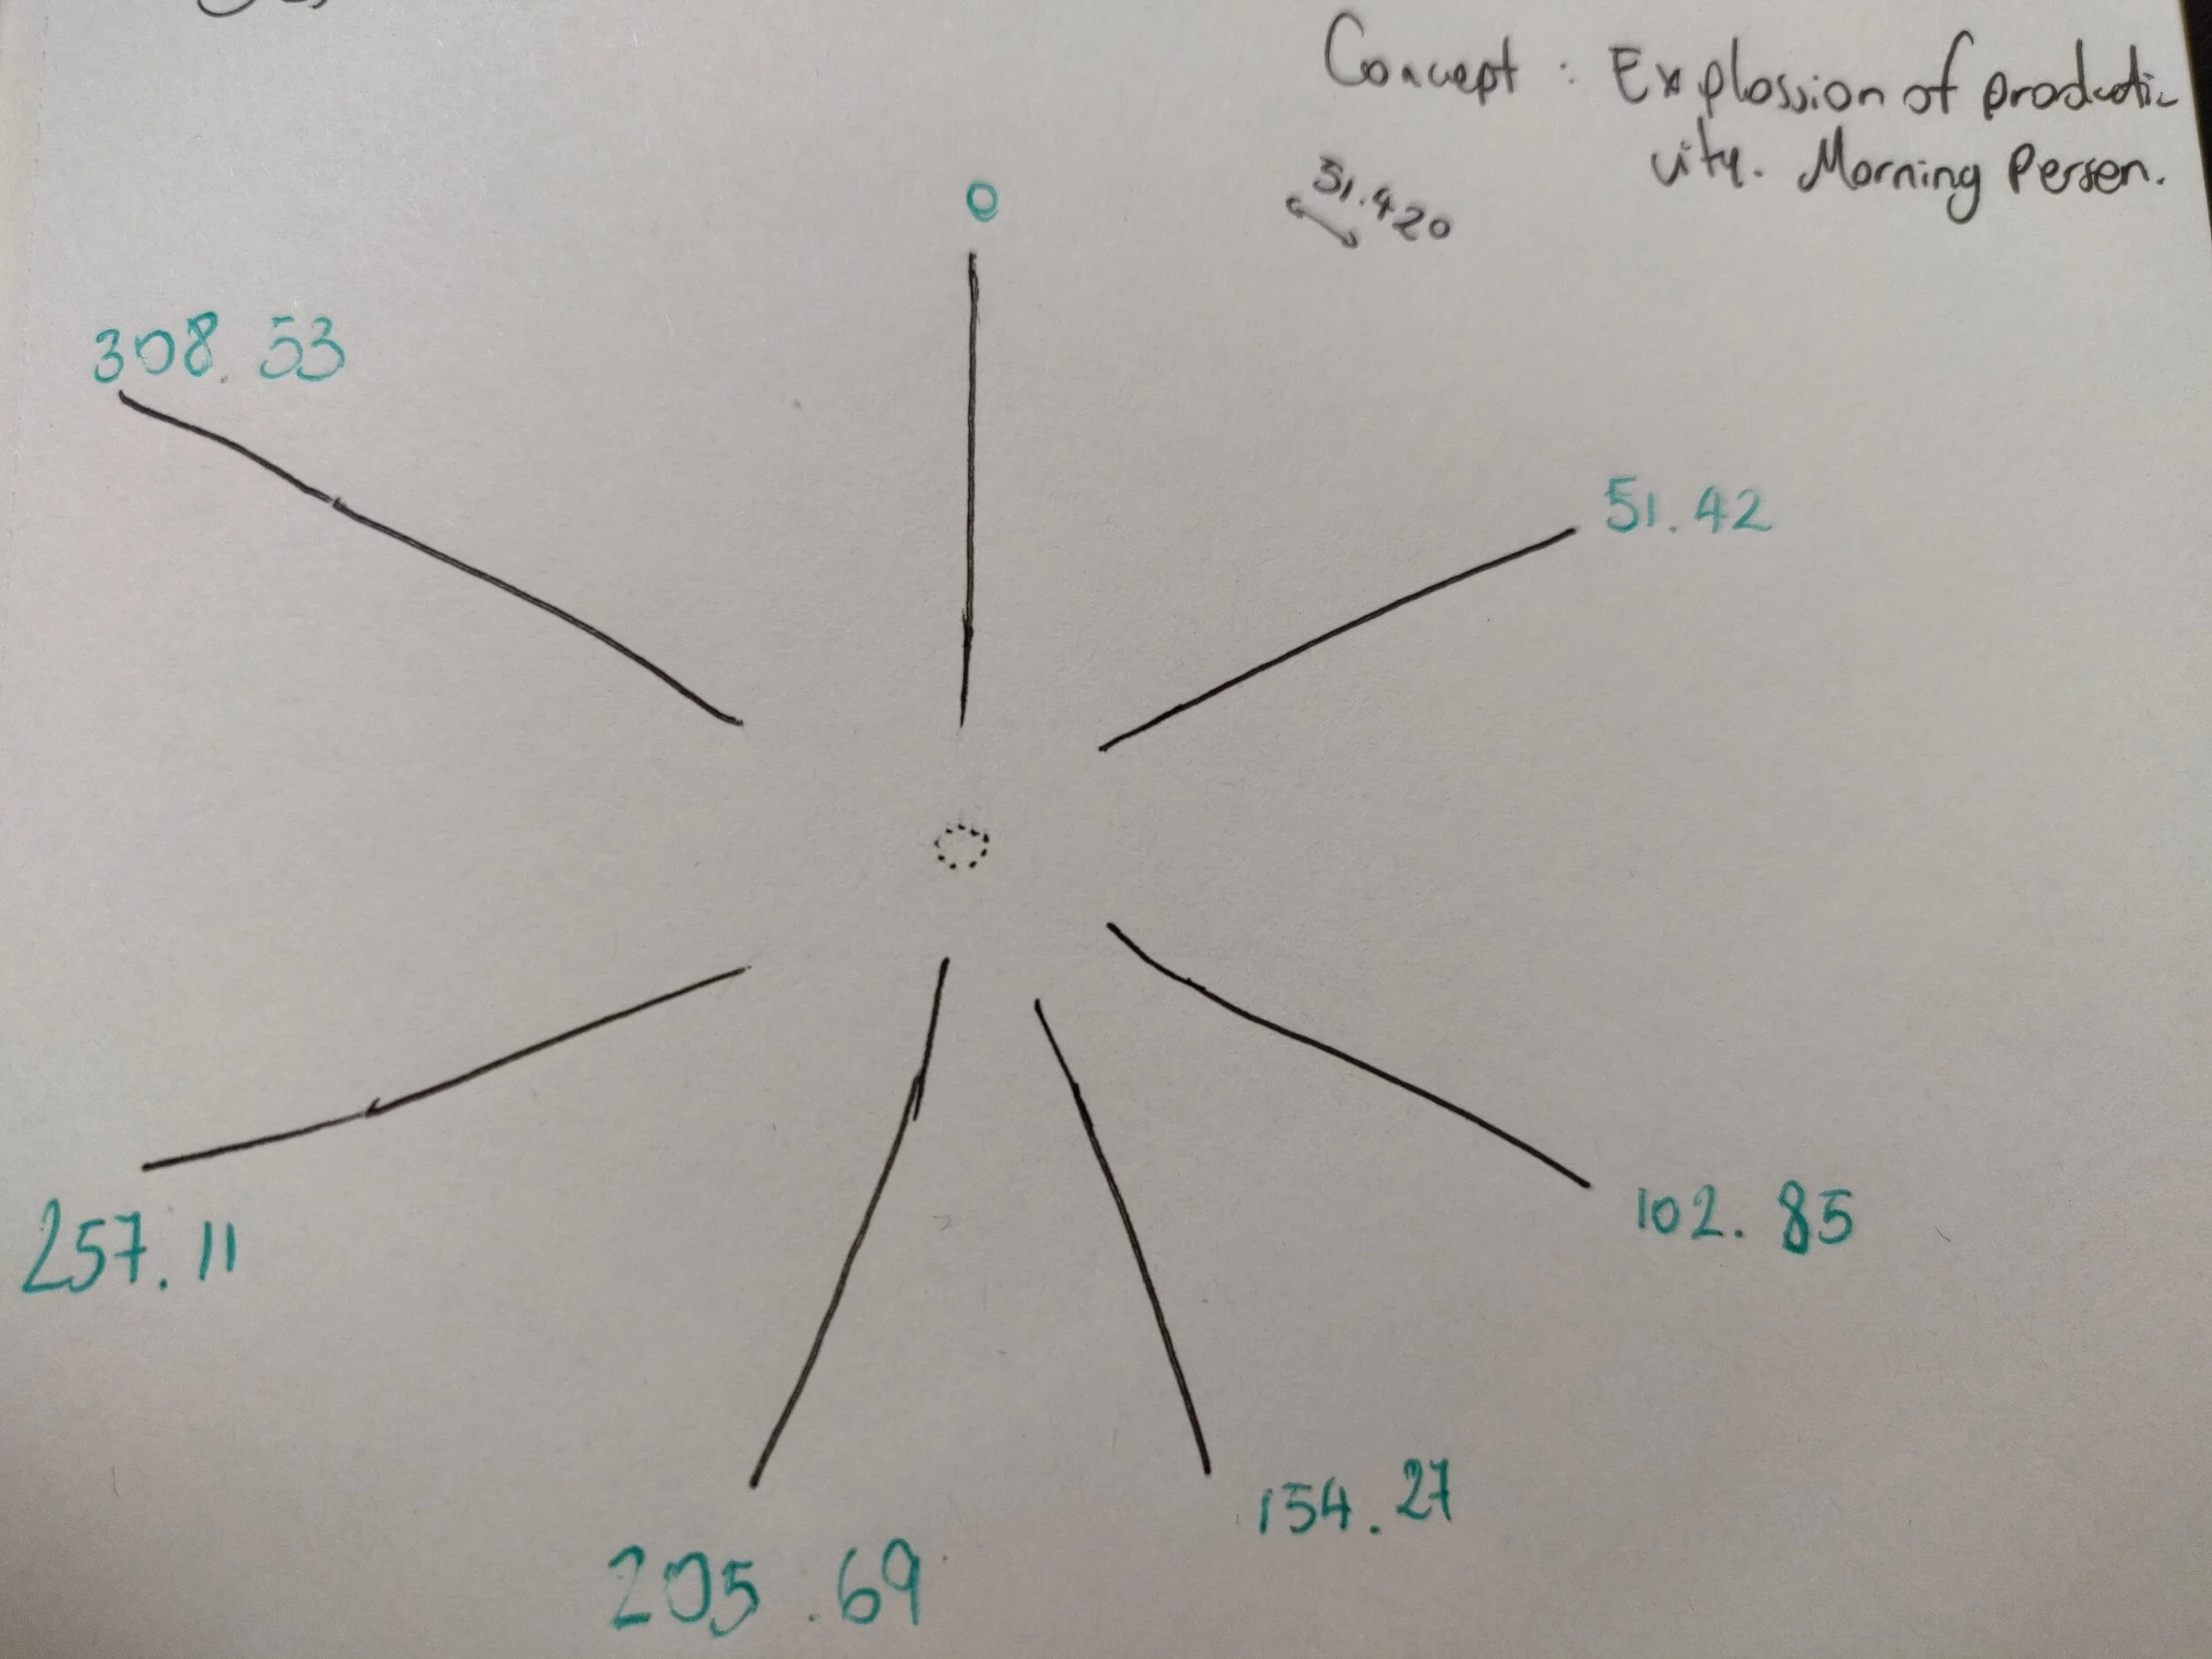
One I collected the information I started to sketch different ways to map the information in a radial distribution, I wanted to relate each day to an individual line and be able to compare the productivity of each morning in a very intuitive way.
Sketching
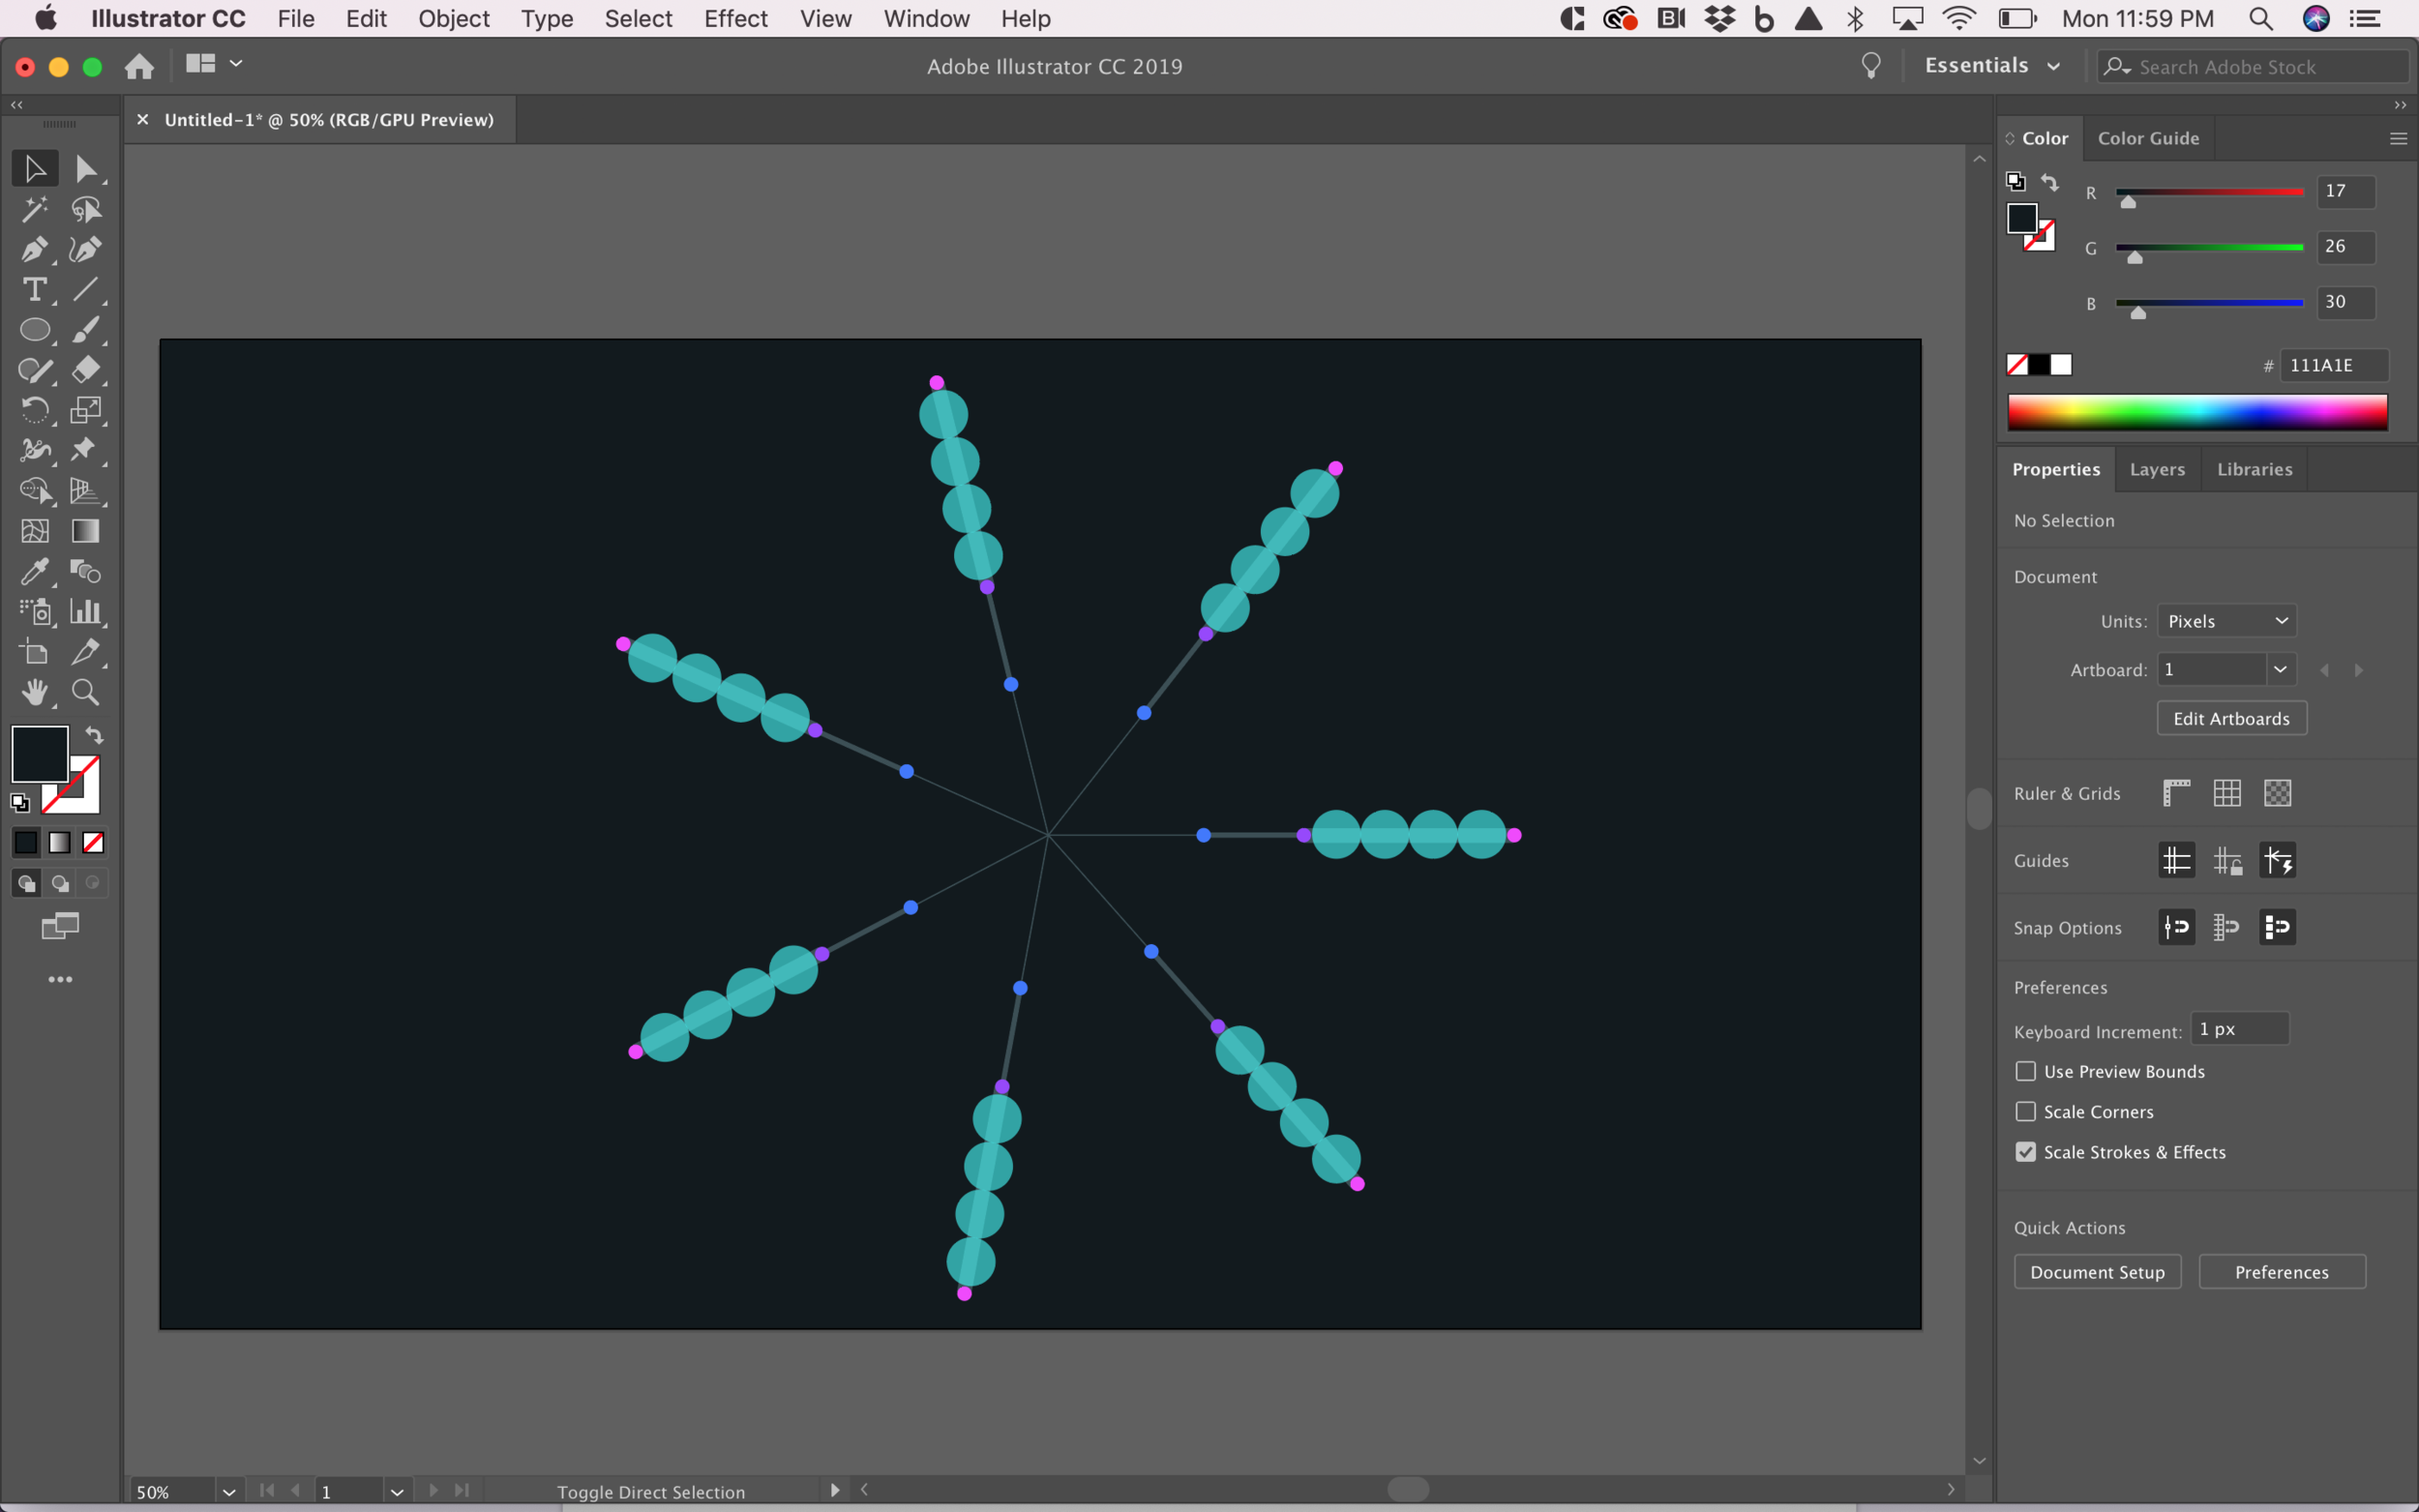
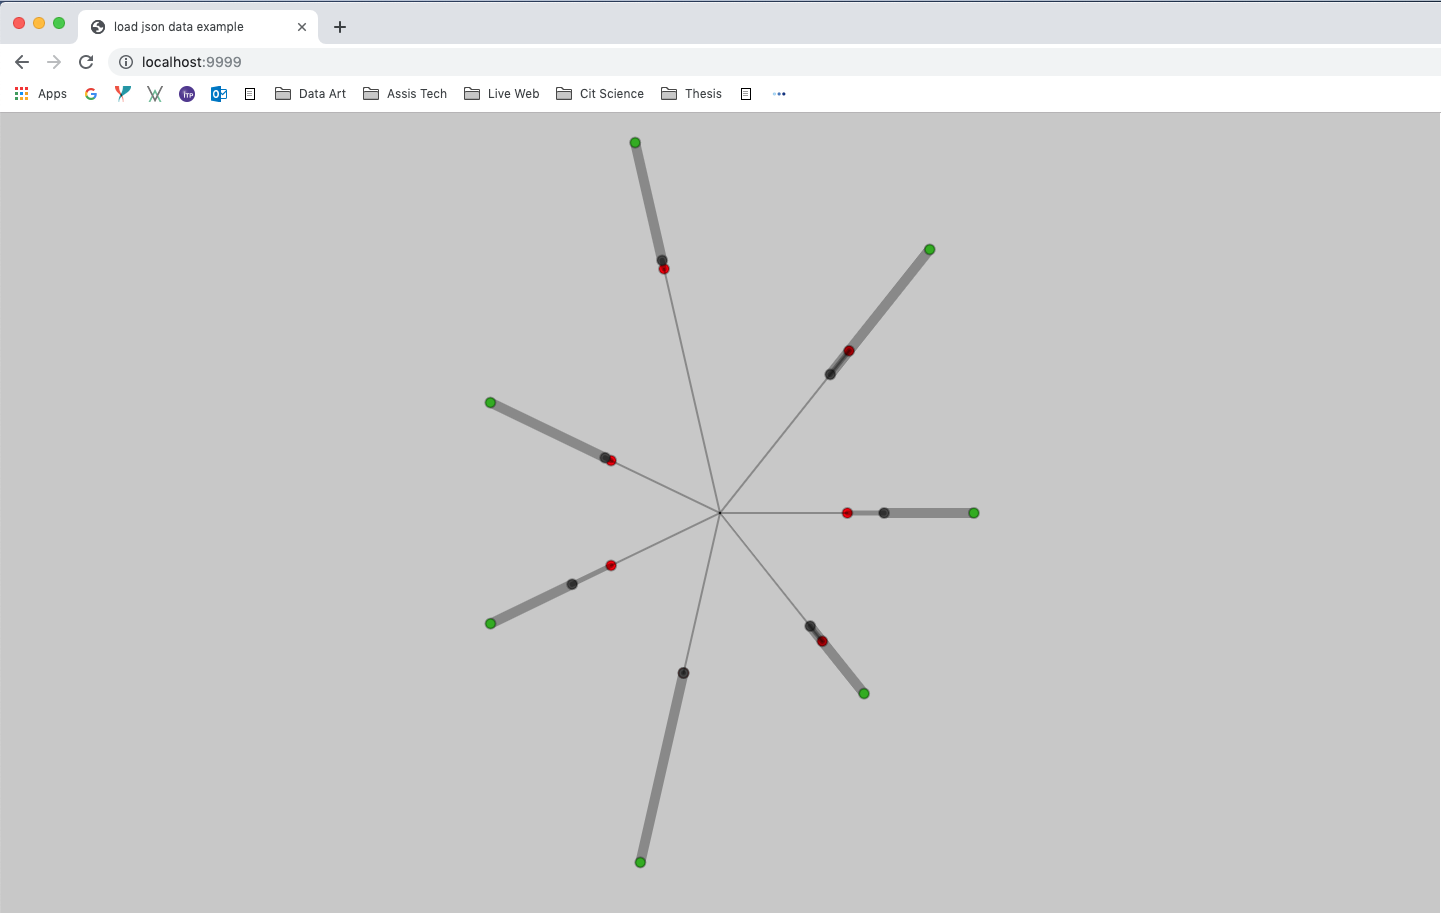
Once I had started to implement the data in my code by creating a .json file from the .csv file that I downloaded from the google form, I started to think about the visual design of the information, the use of shapes and different colors to represent the data in order for the viewers to understand the content of the graph. I used Adobe Illustrator to define a color palette, the diameter of the circles and the thickness of the lines, and later on, apply those visual details to my code.
Prototyping in Illustrator
Once I started to move forward with the coding portion of the assignment I started to face some barriers, I noticed that I should have created a more object oriented programming code in order to be able to access each individual day’s data, and I also notices how the visualization of the amount of activities was missing some context and I wasn’t able to display it in the way that I originally intended in my visual design. It was important to notice that in my Illustrator file I was able to create a design with a lot of freedom however when it comes to coding, that freedom has it’s consequences because that means that the coding will get more complex and I might not be in a point where I can achieve all those components.
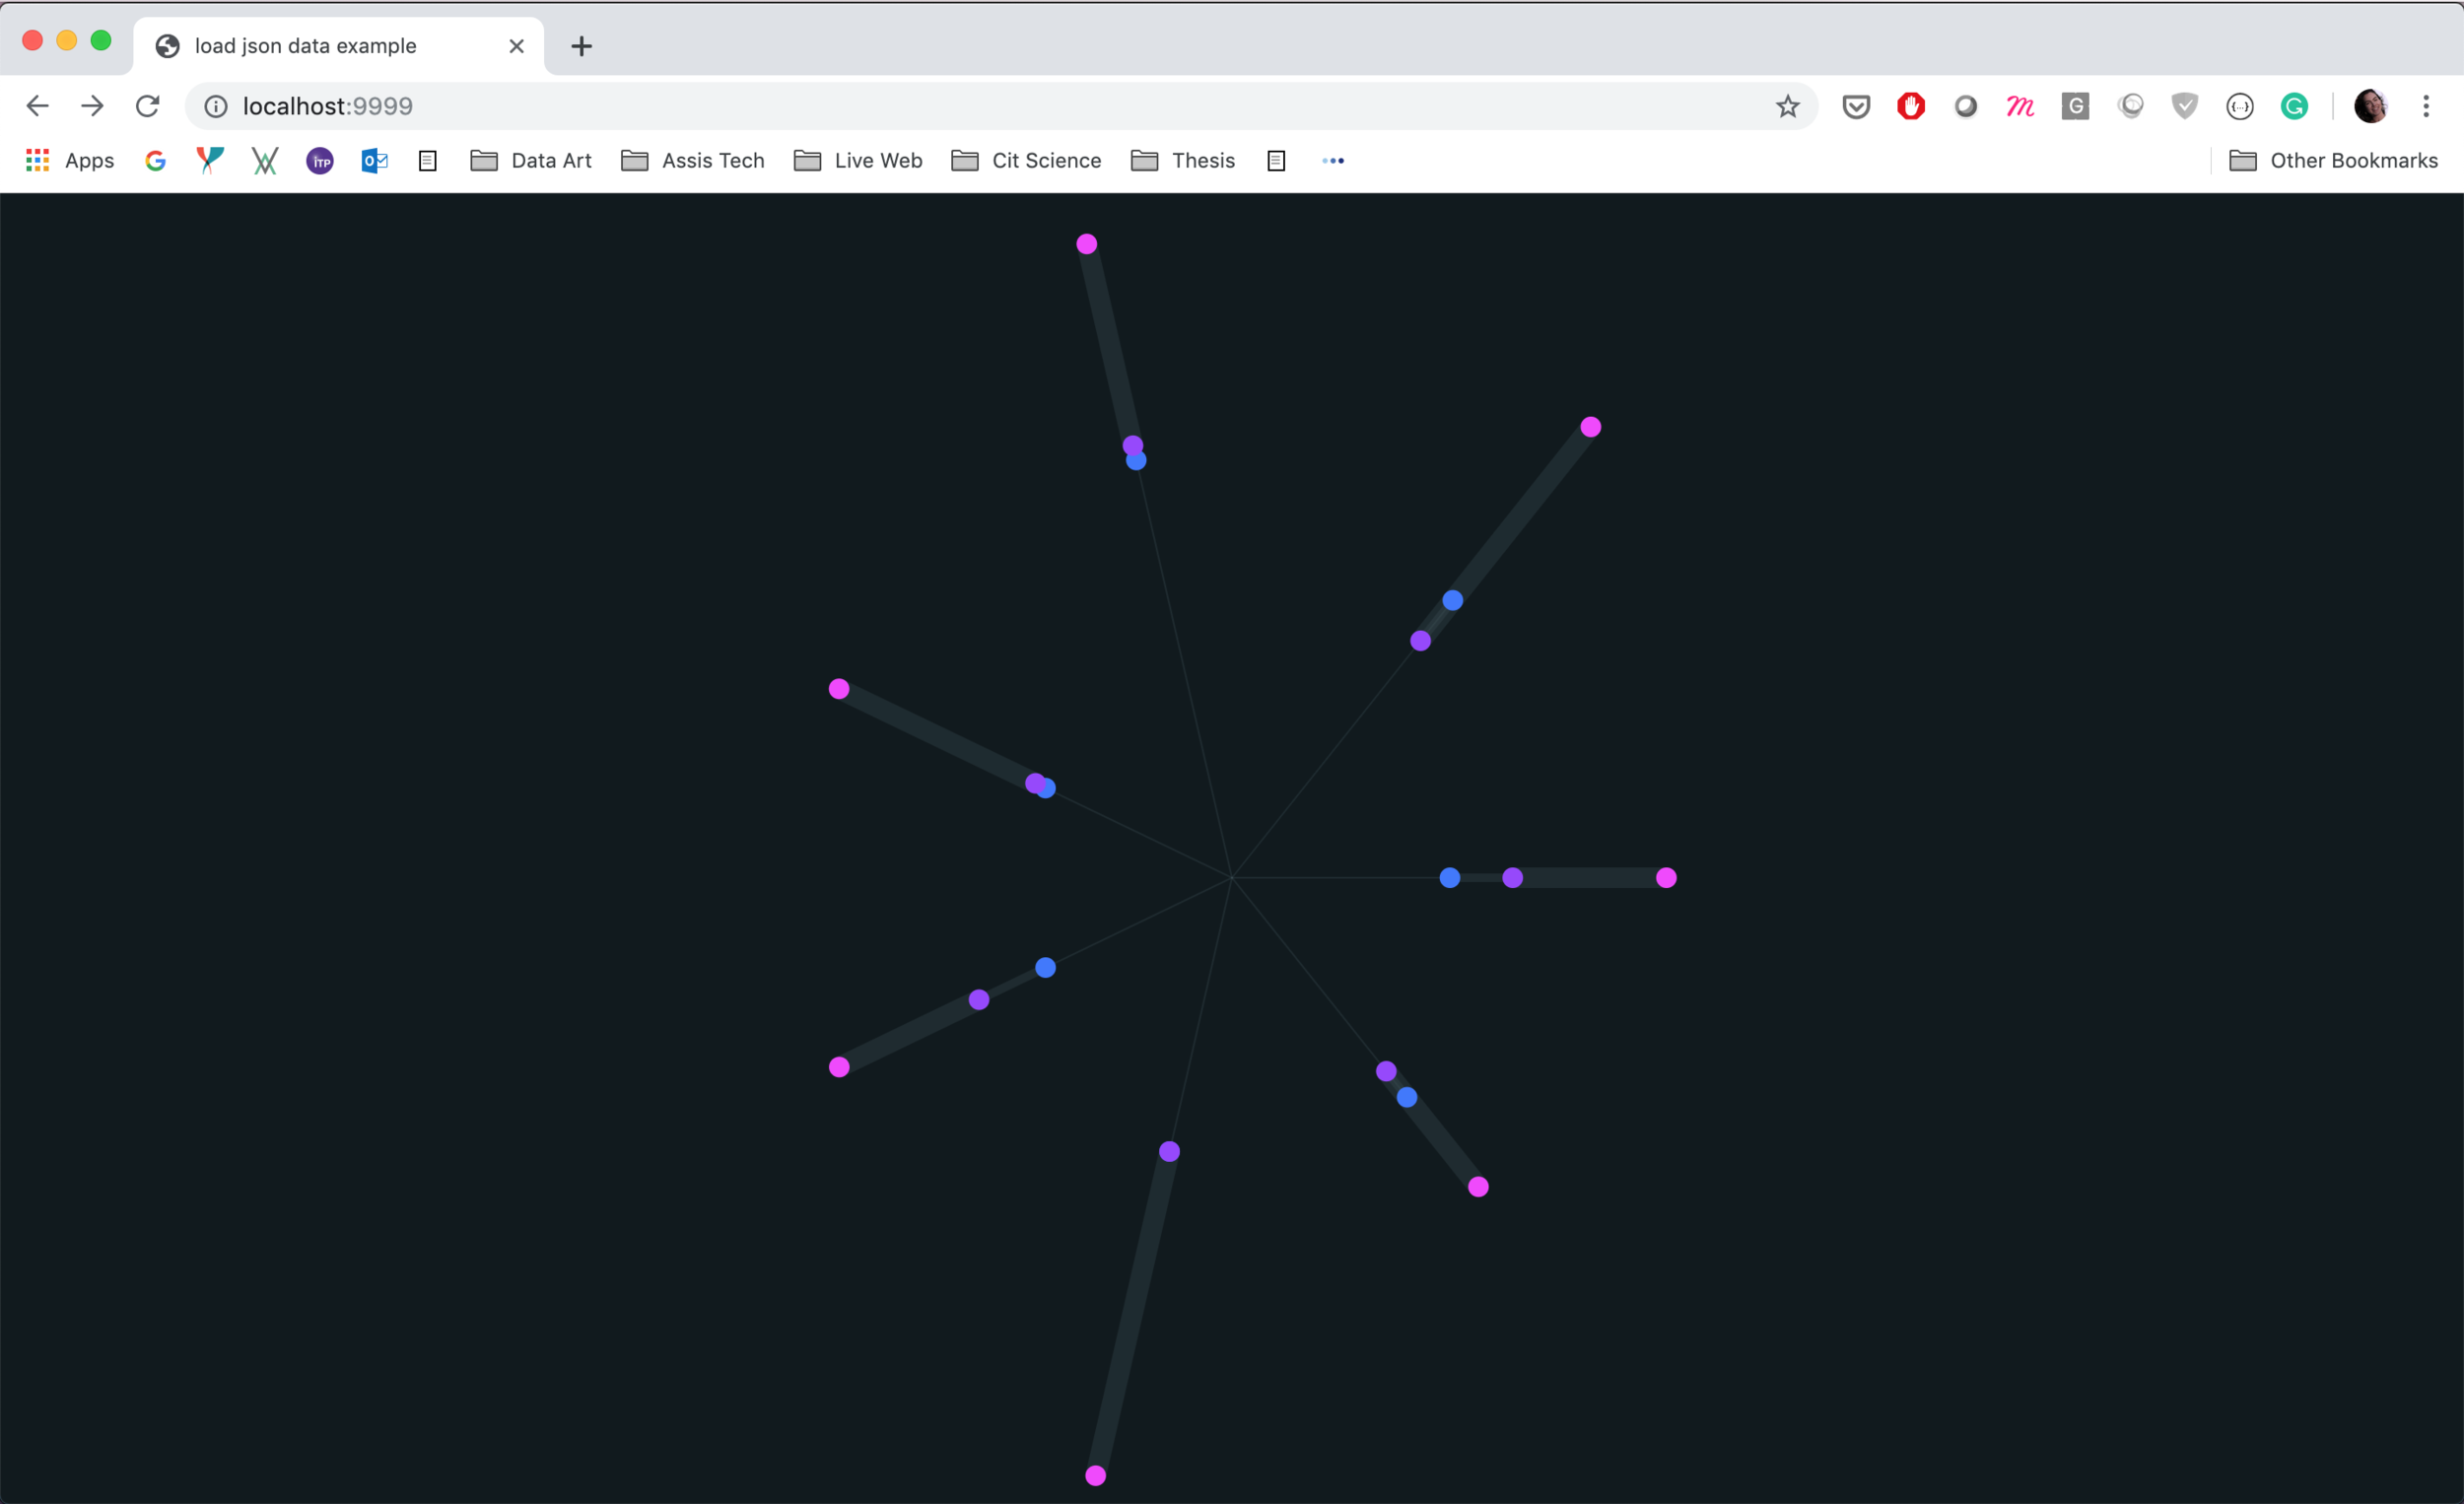
For the coding portion of the assignment I used p5.js in order to create the circular distribution of the days by using the cos and sin functions and creating different shapes (ellipses and lines) that were distributed in radial lines by dividing a circle in 7 in order to represent the totality of the collected data (7 days of the week).
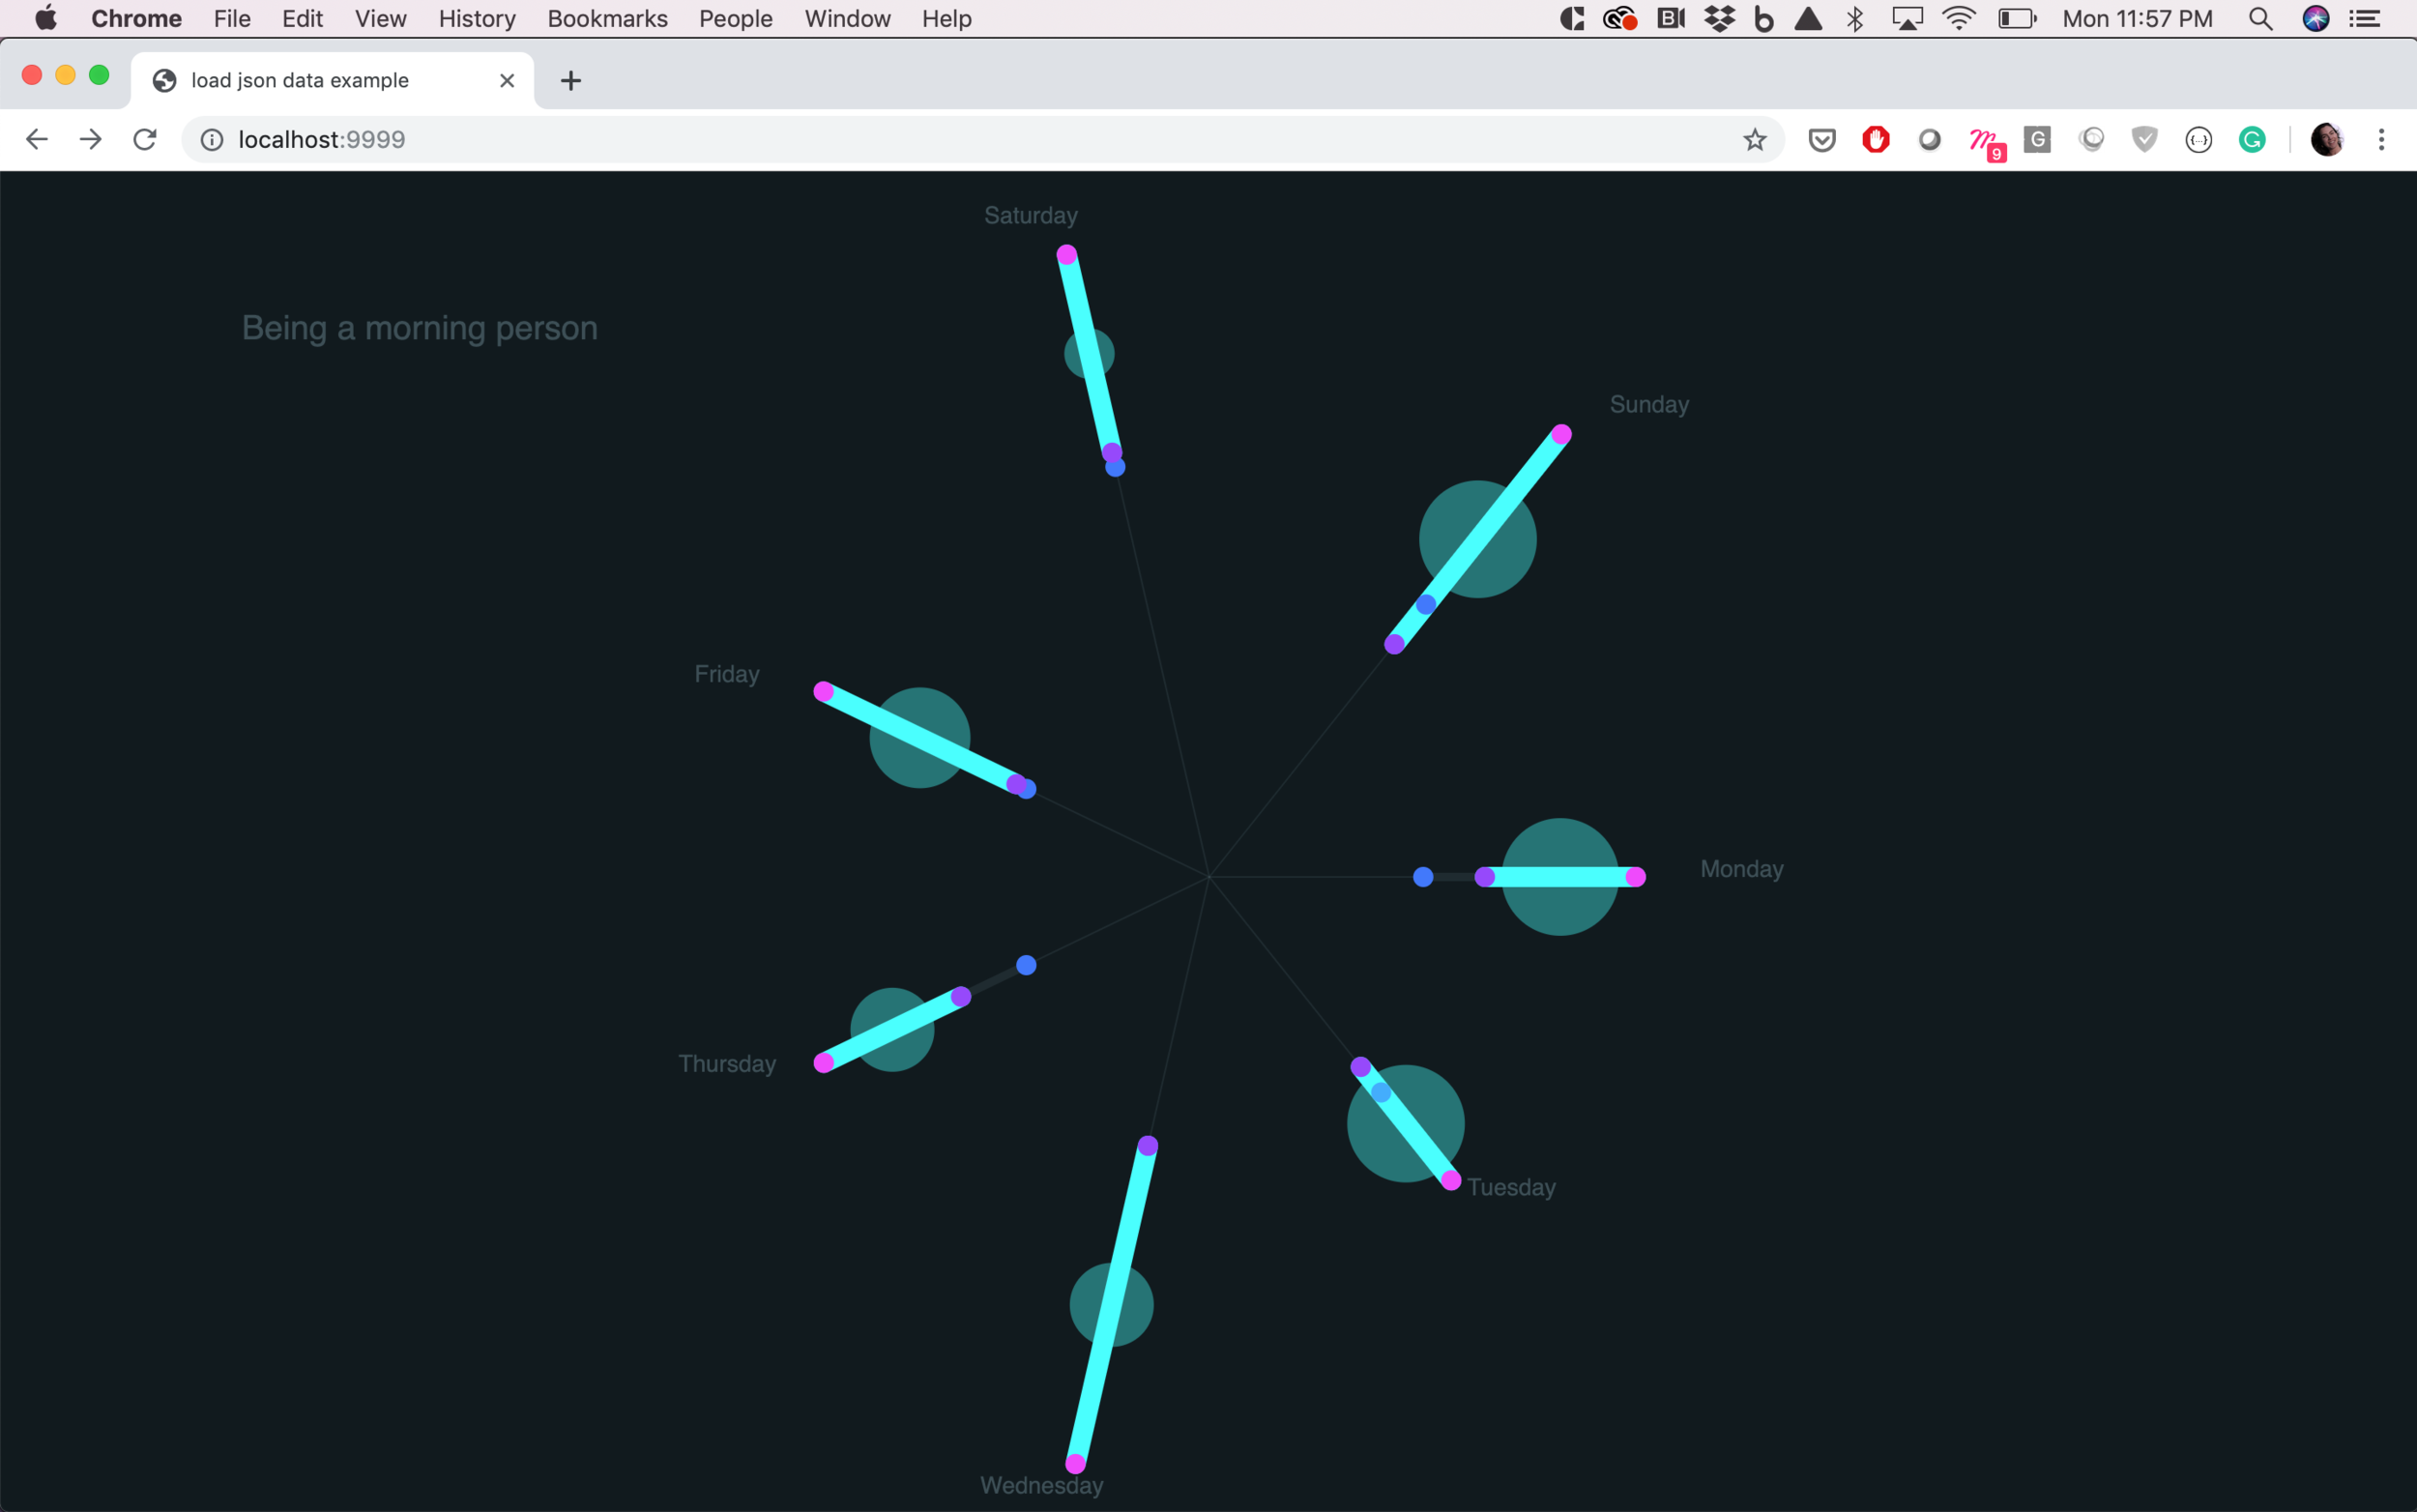
The final result is a data visualization that shows the intended wake up time (blue dot), the actual wake up time (purple dot) and the time that I arrived to my destination (pink dot). All those data points are displayed in a radial layout and I decided to represent the “effective” morning time by changing the stroke weight and the color for turquoise. It is possible to identify visually the duration of each morning and compare with the other days of the week. The last layer of information that I included was the mapping of the amount of activities done each morning, to the diameter of the semi-transparent turquoise circle that is located in the center of each morning stroke, the bigger the circle the more activities I performed that morning.
It is possible to visualize the difference between very productive mornings, such as Monday and Tuesday, in which the duration of the morning was short but the amount of activities performed was big, versus days like Saturday, in which my morning was very long however I didn’t perform many activities, therefore was a more inefficient morning.
Final Visualization

