Data Art Final Project: Unquantifiable

For the final project I decided to collaborate with Cara Neel, we have been sharing ideas during the semester and we knew that our interests aligned in some topics that we wanted to visualize together. We decided to work around the topic of the Immigration Policies under Trump’s administration and its phycological effects on children and adults that are being separated in the border.

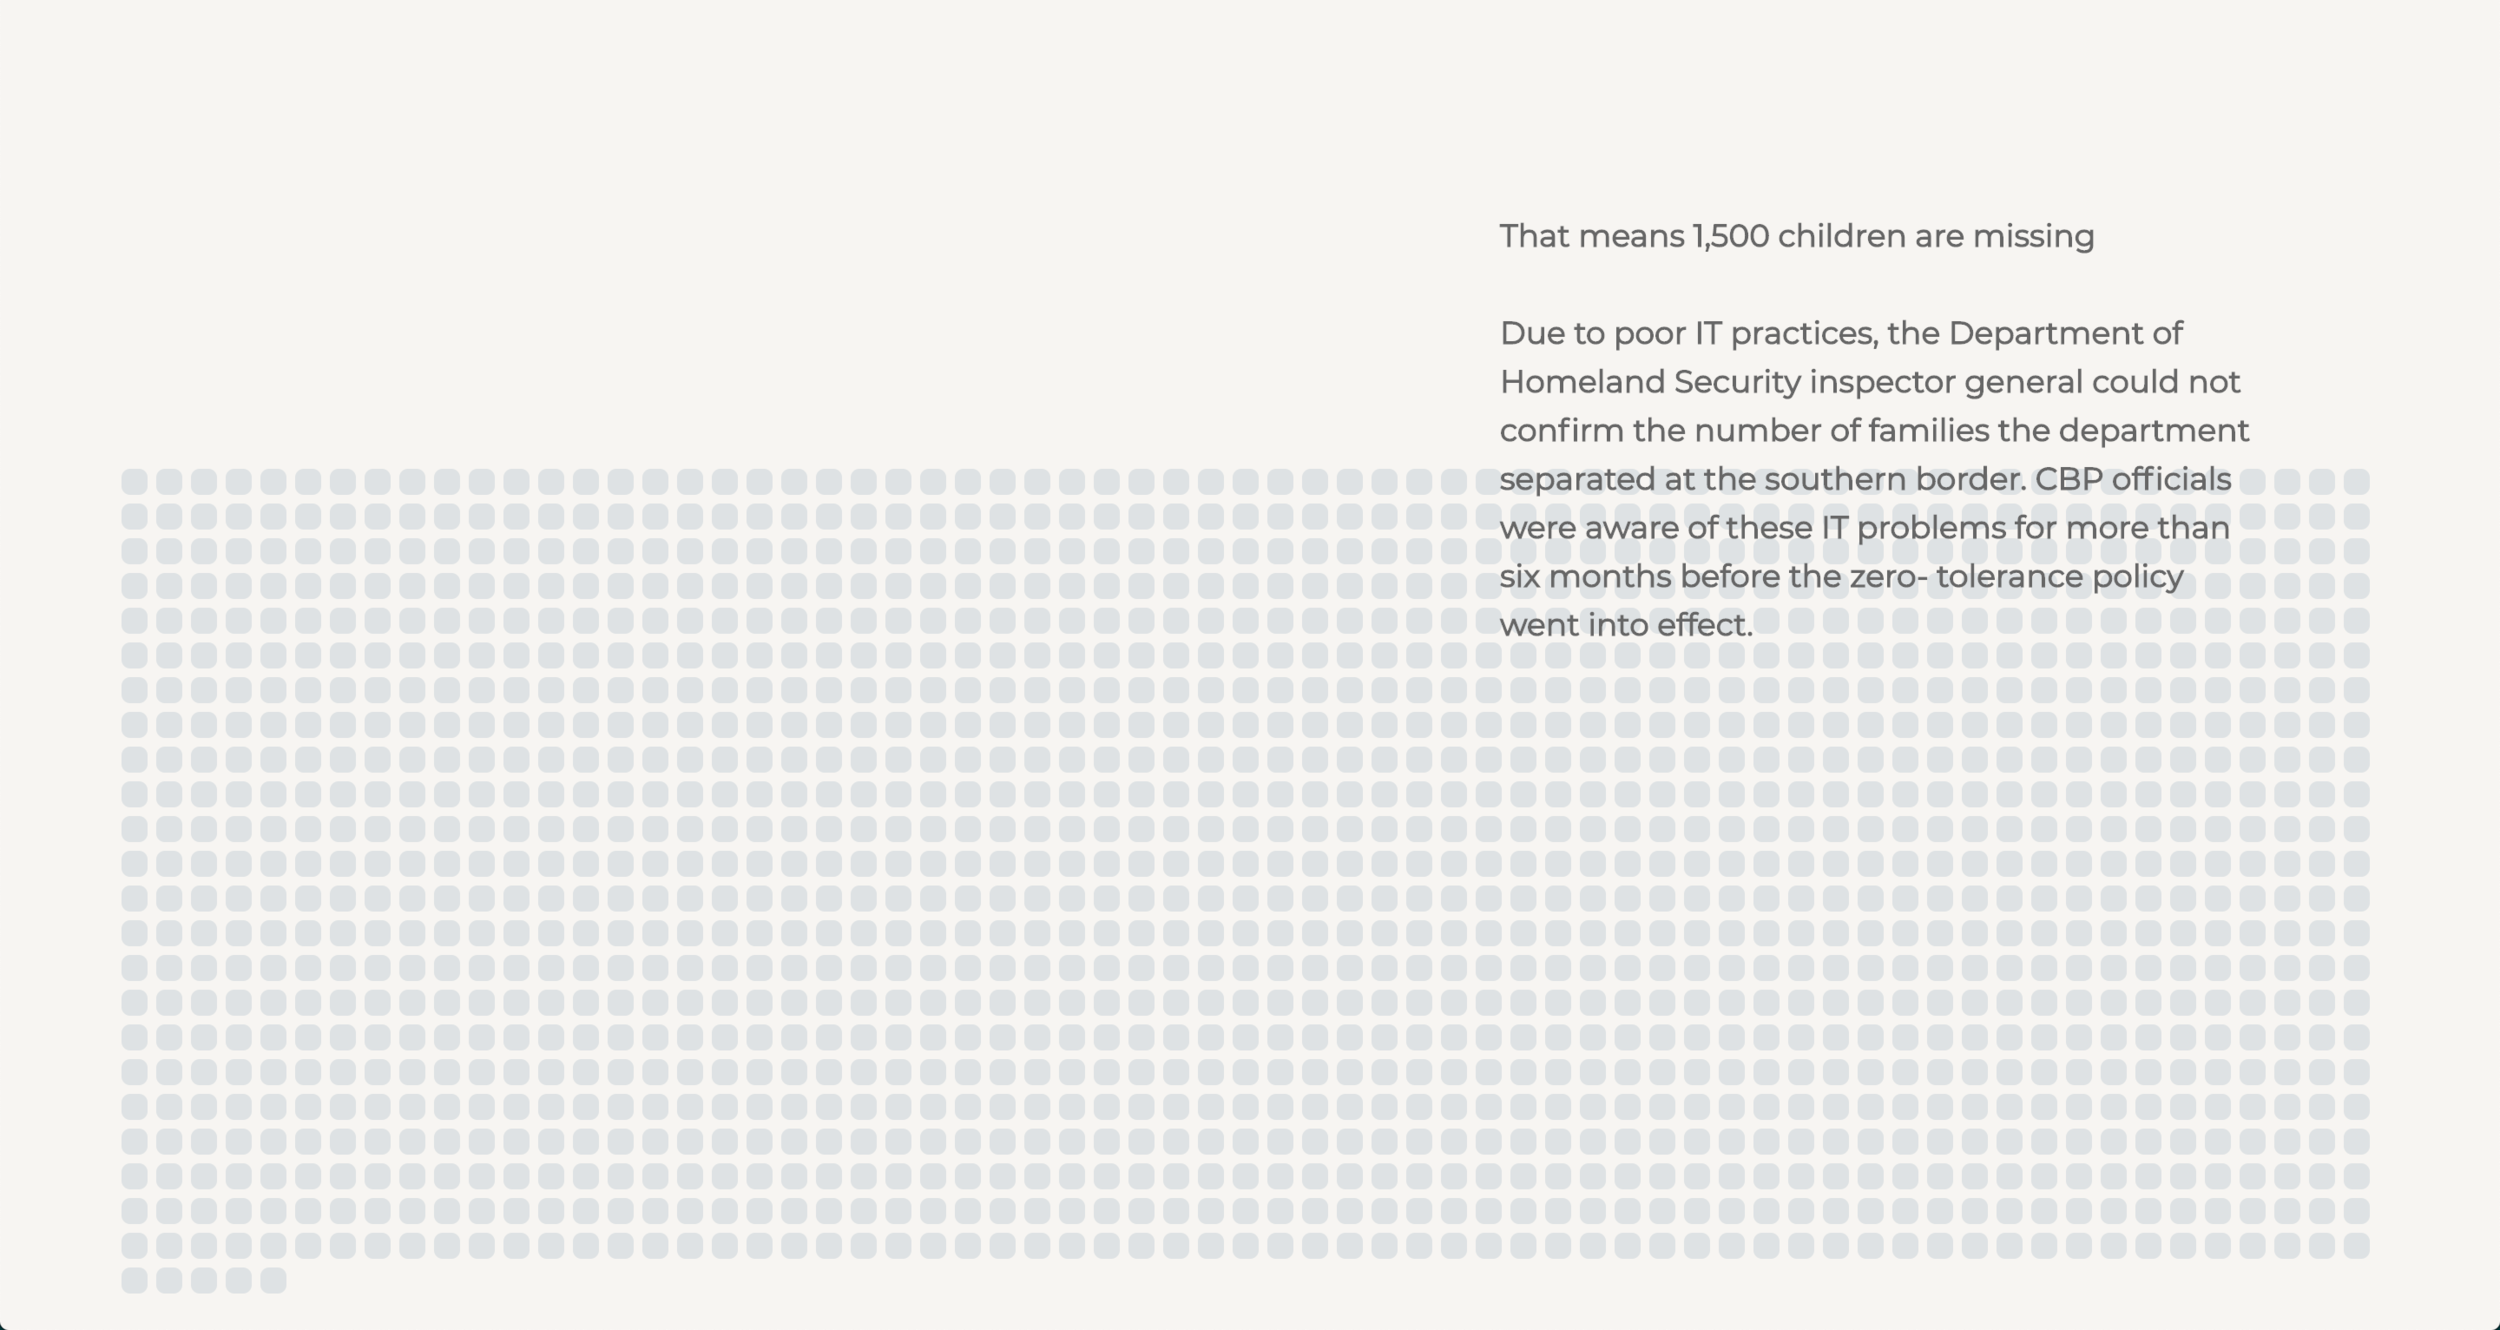
The main goal for the final project was to do a data critique so we decided to focus on displaying visually the way that some data is quantified, and then generate a critique about the fact that some of the data is not being collected in an ethical way and also how the poor IT techniques are affecting the families that are currently being separated in the border.

The process begun by establishing certain charts that we wanted to use in order to display specific data points that we found online, we knew that we wanted to accomplish a “Scrolytelling” look and feel and we wanted to divide the experience between the data that can be quantified and the data that can’t.

In the development process the first step was to create a shared collaborative document in which we could document our research and divide the information between the desired charts.

Content strategy

Content strategy

I the next process I created a sketch file in order to translate the content into a visual representation so that we could try to accomplish the front end following the visual structure that I defined in a static wireframe developed in Sketch.

Static wireframe in sketch

Static wireframe in sketch

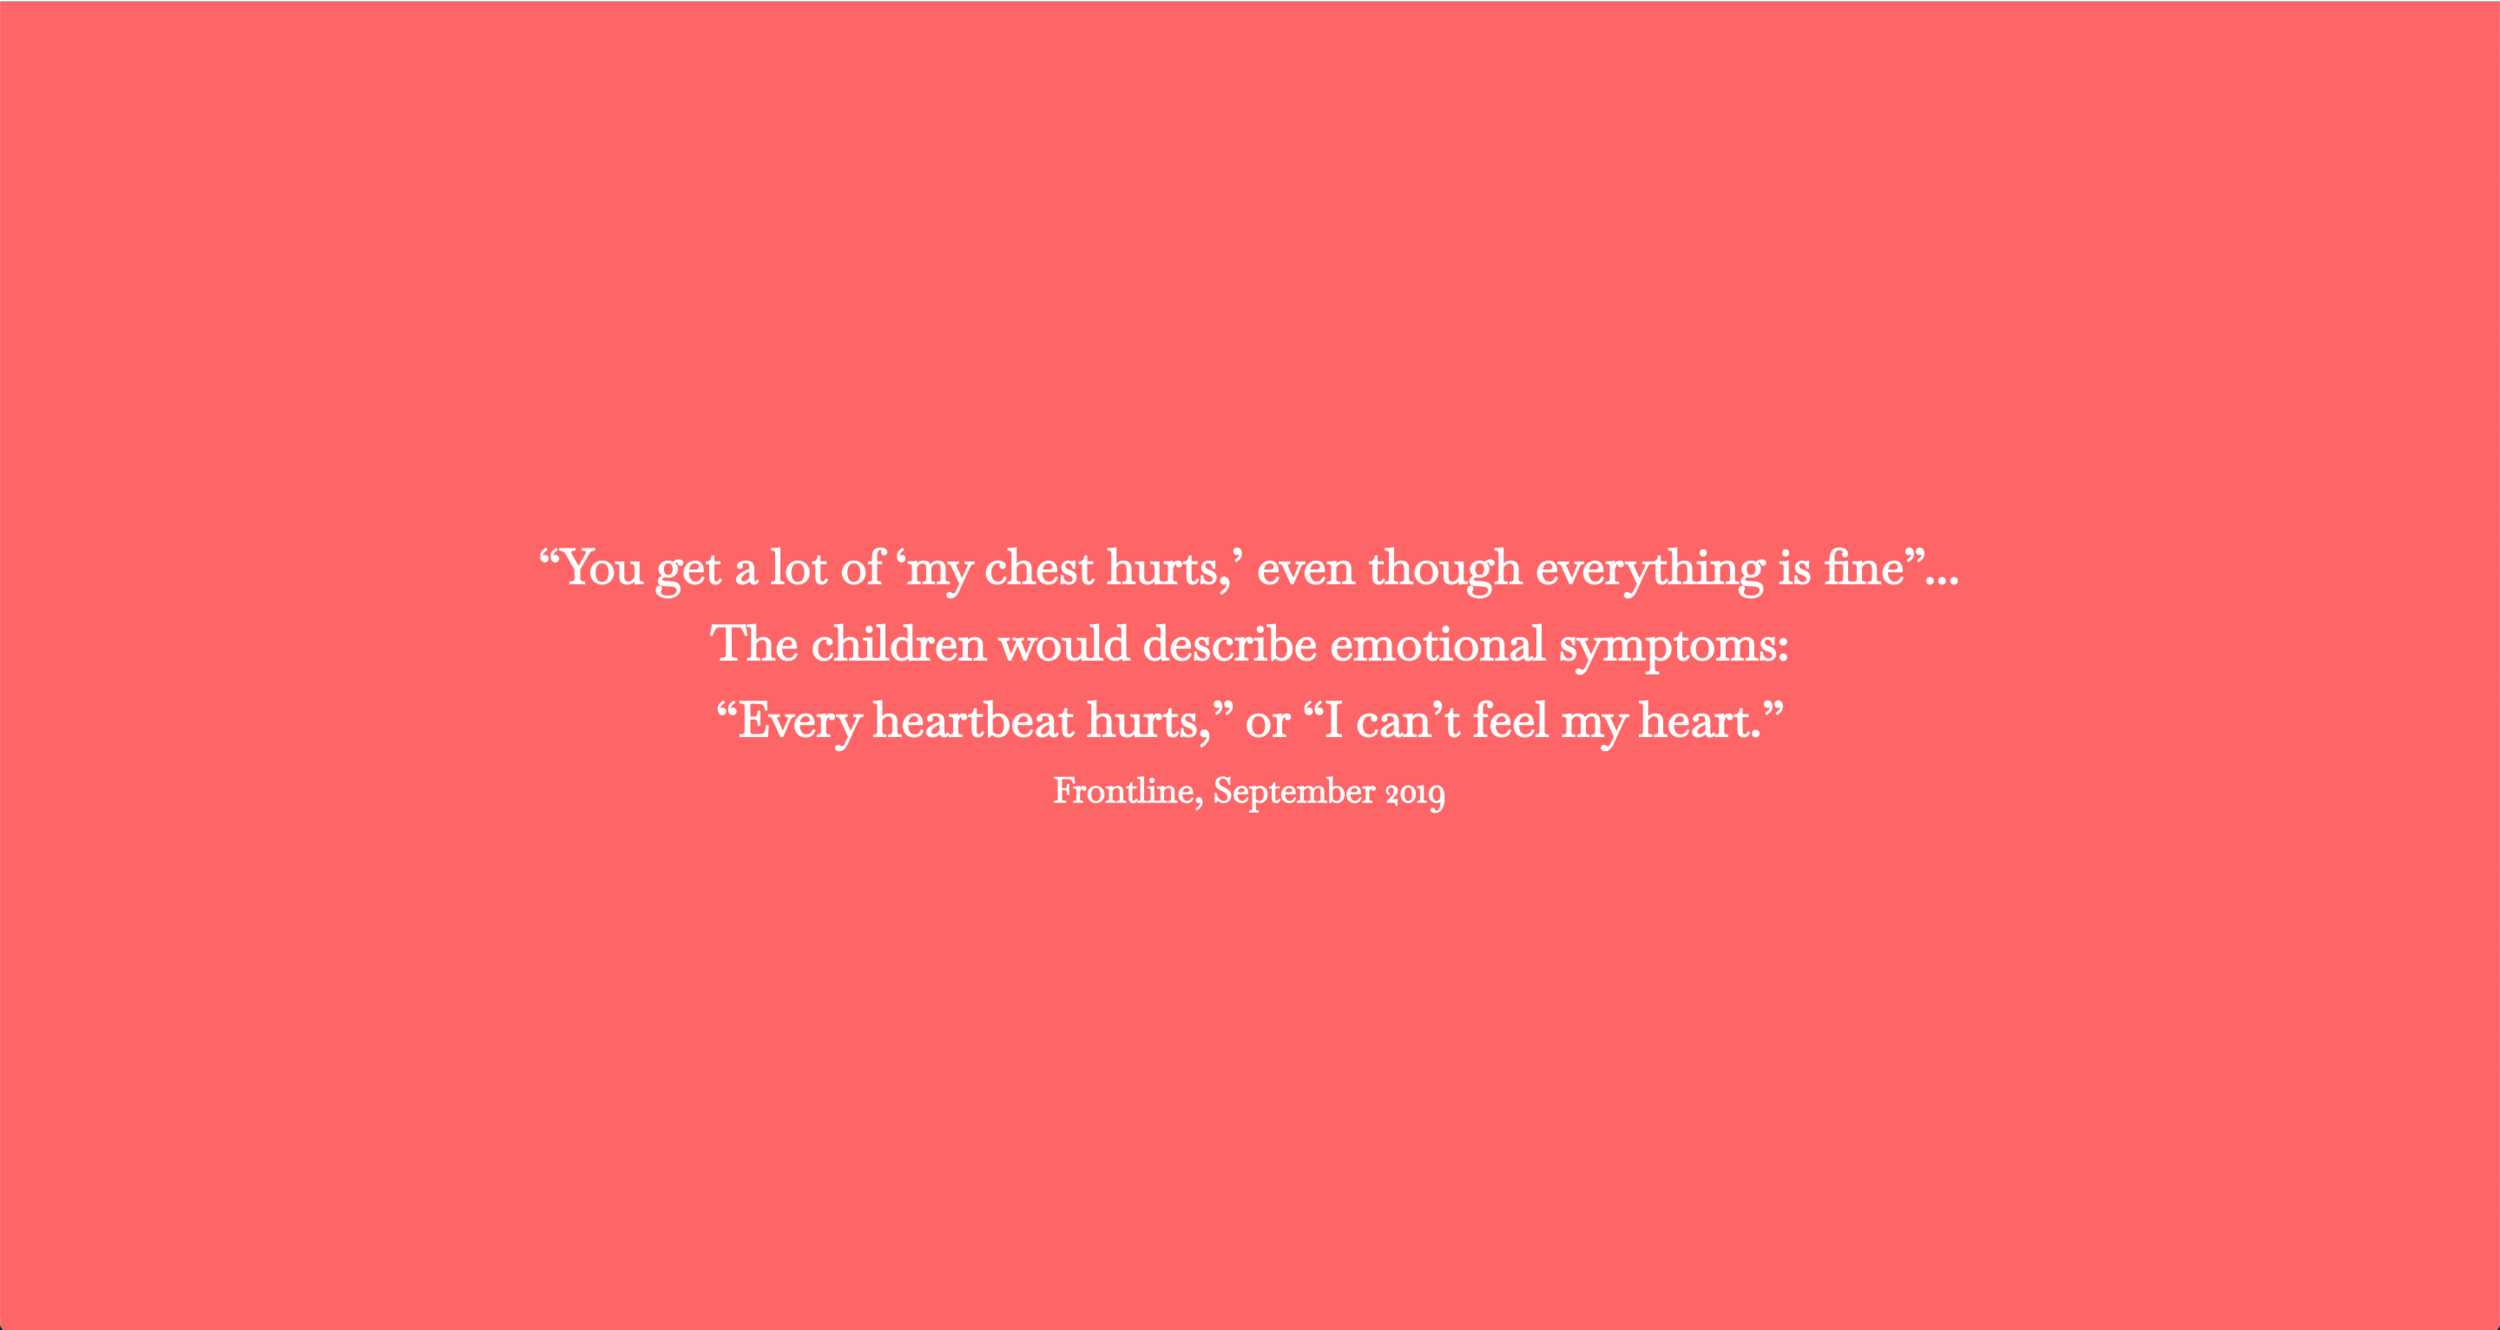
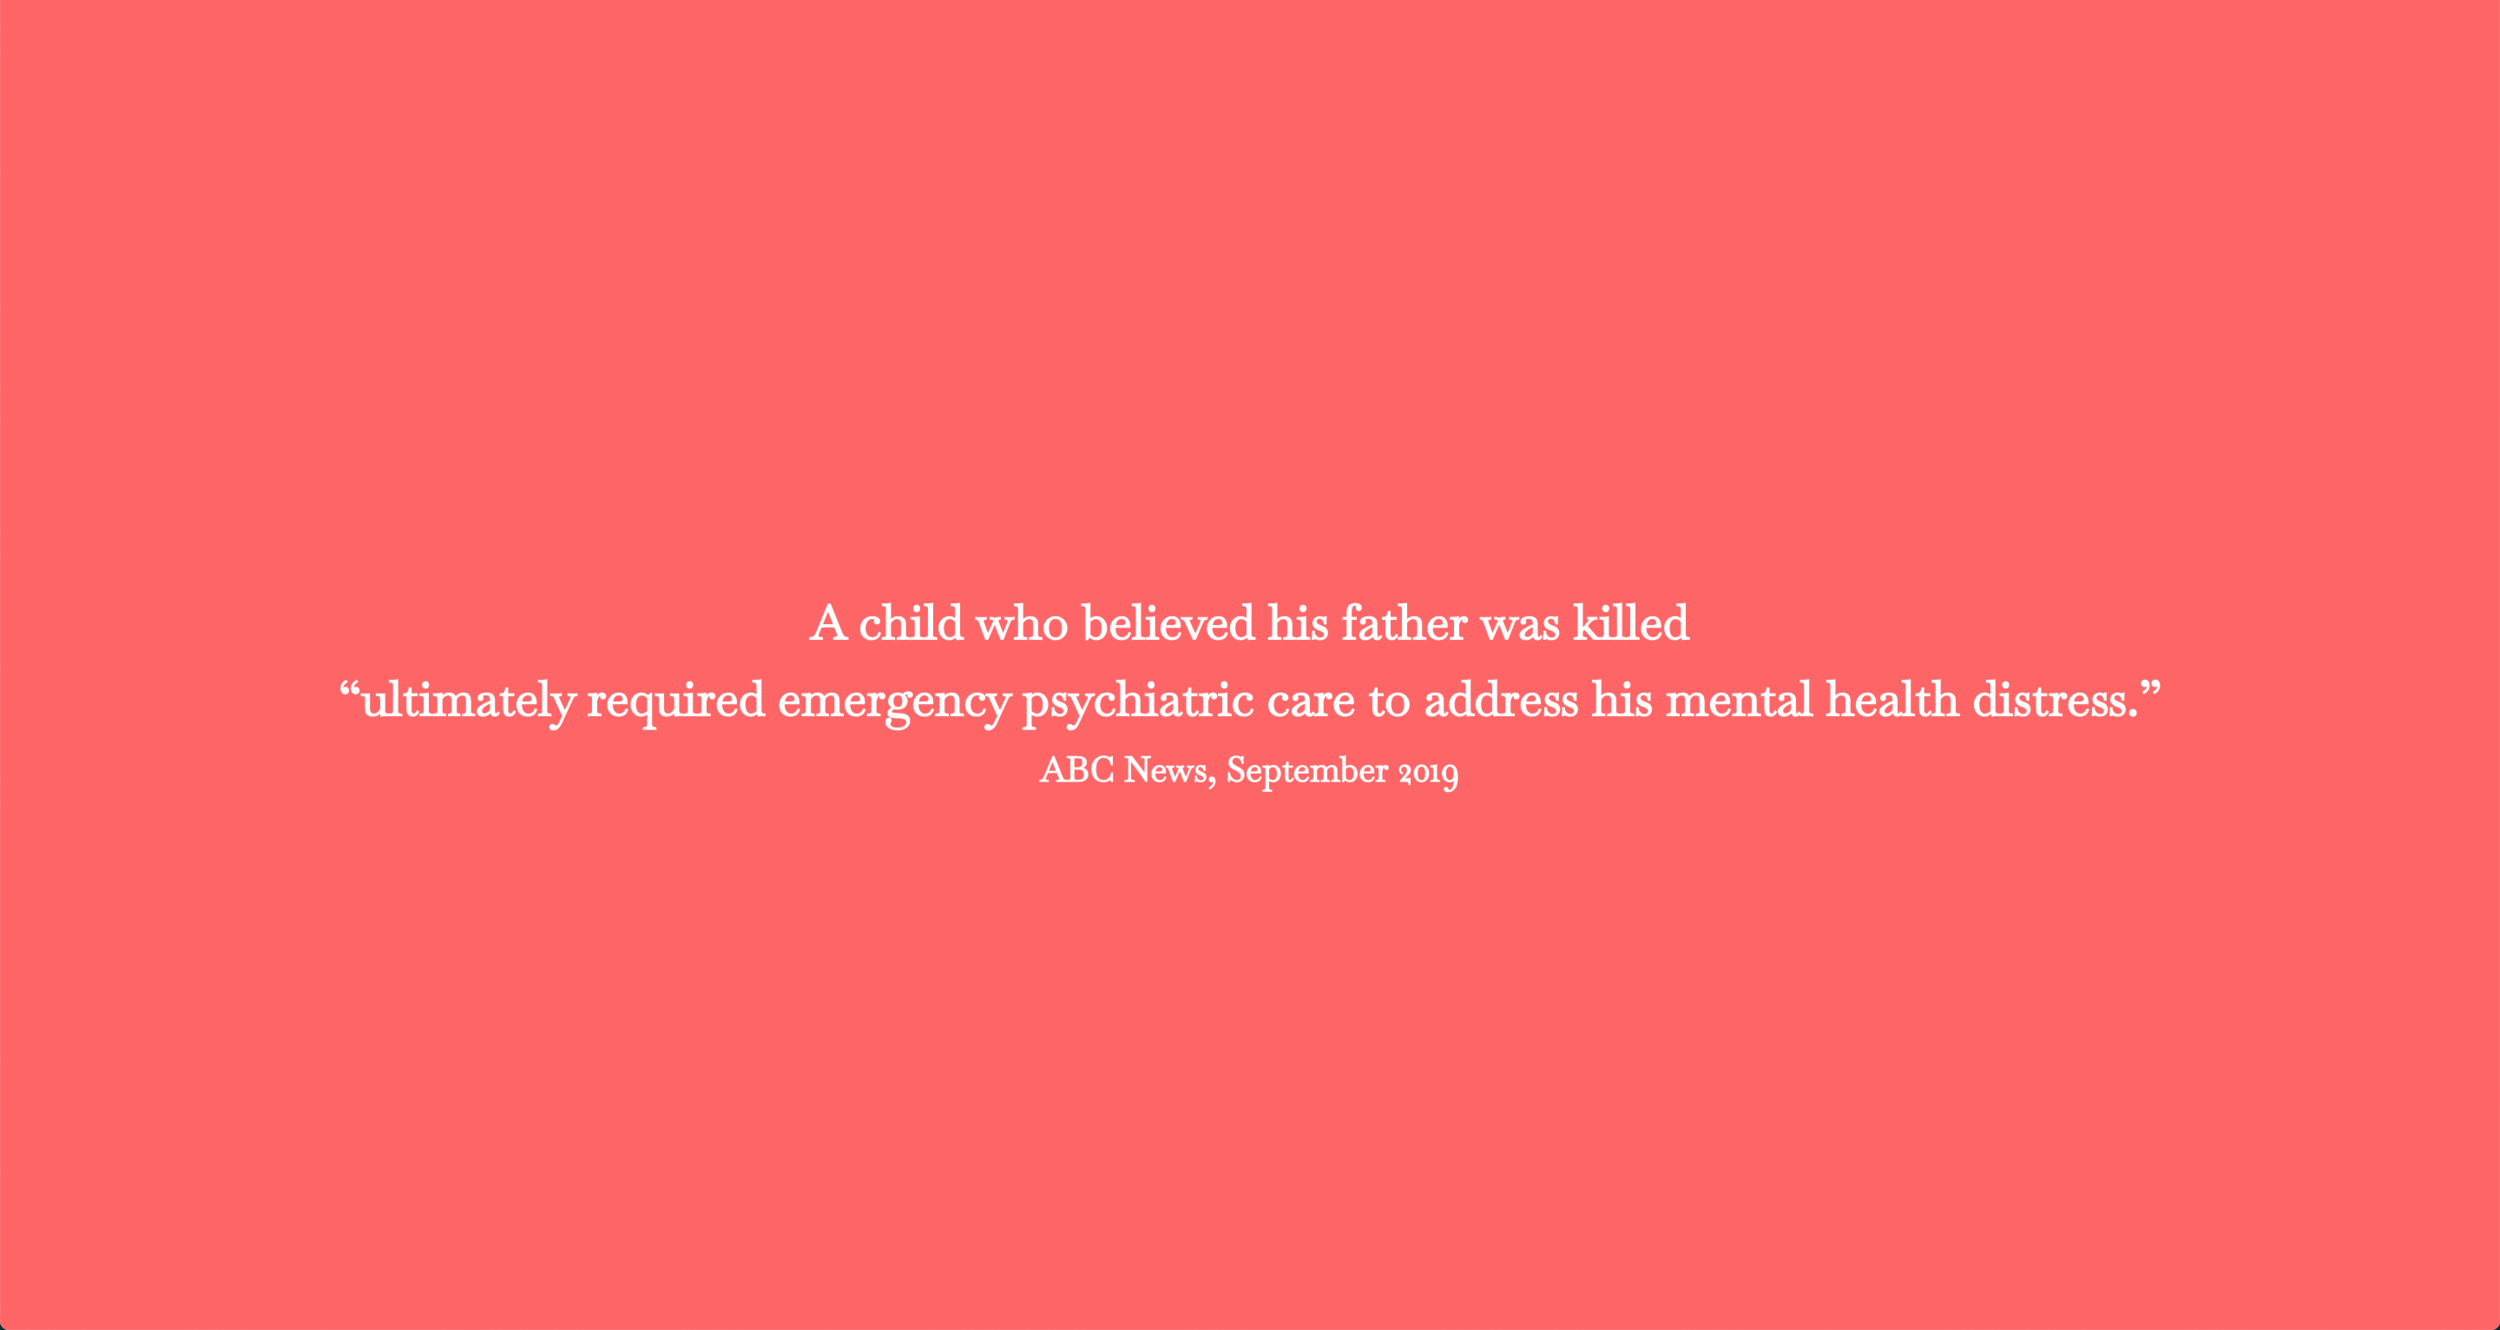
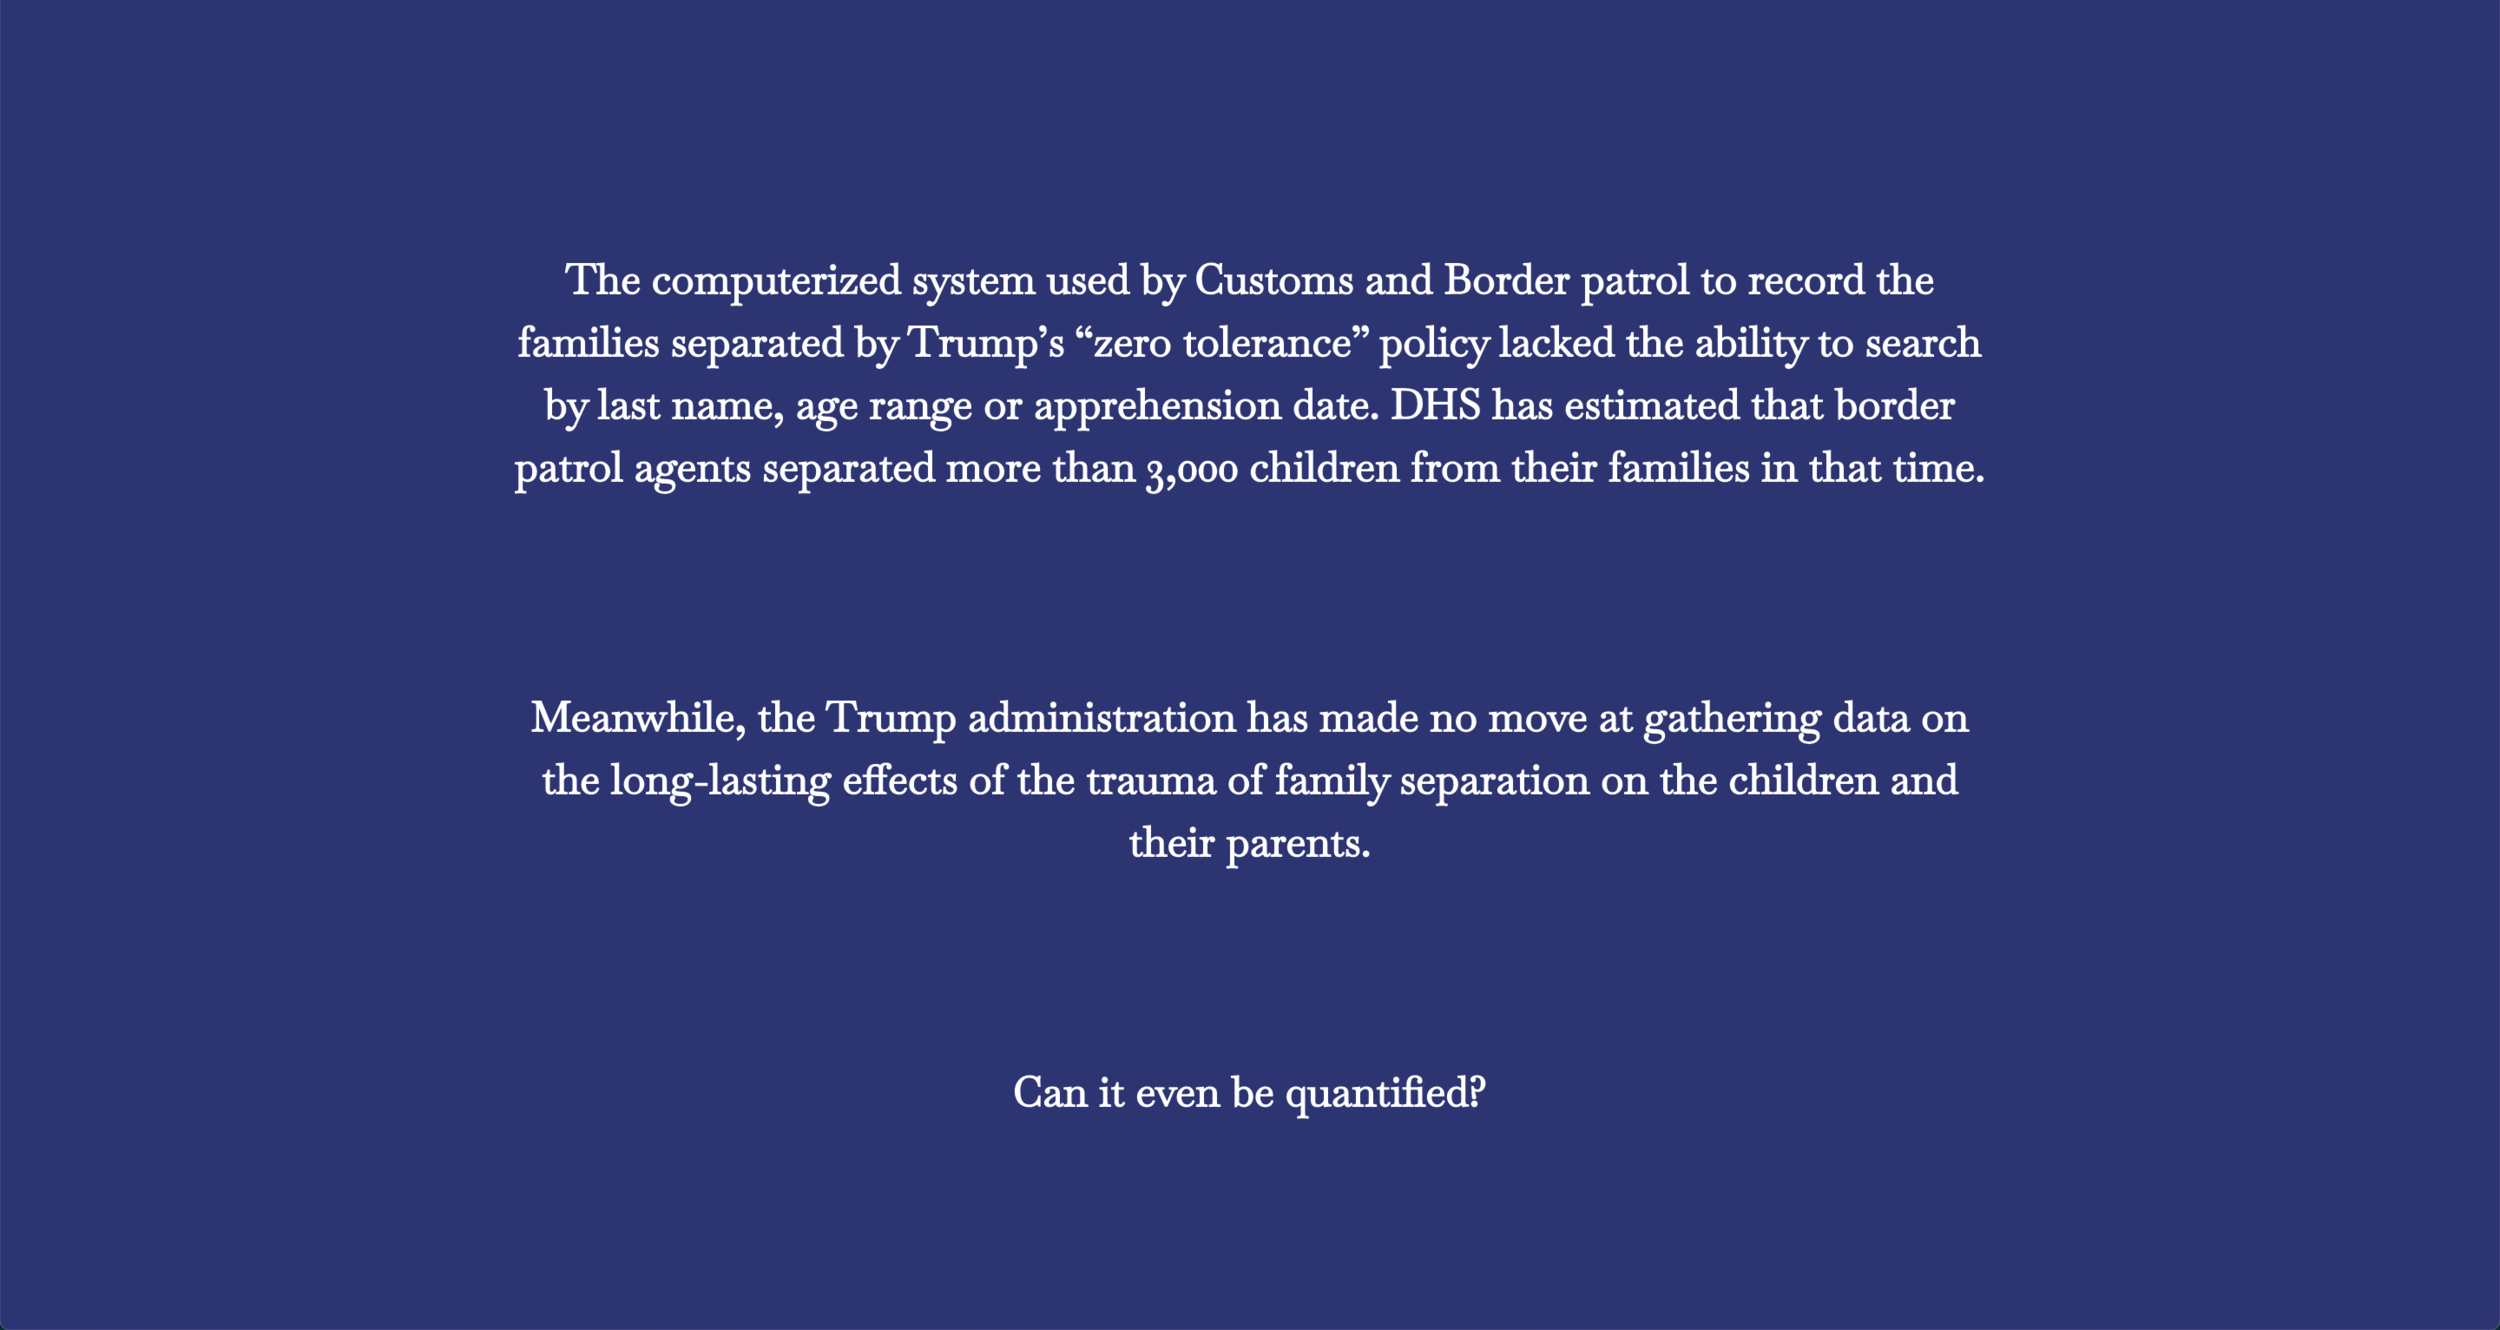
The last phase of the project was to develop the front-end and actually code the website. Since we decided to use d3.js and neither of us was an expert on it, we had to cut back on some of the charts and implement a simplified version but always keeping the concept of dividing the quantifiable from the unquantifiable (which we decided to display as stories or quotes).

The coding process was done between both Cara and I by doing peer programming, we met multiple times and coded together, sometimes one will lead the computer while the other would observe and viceversa, which allowed both of us to understand and learn a lot from the code.

The final result is a scrollytelling data visualization:

Sources:

https://sph.umich.edu/pursuit/2018posts/family-separation-US-border.html

https://www.apa.org/news/apa/2018/border-family-separation

https://www.latimes.com/science/sciencenow/la-sci-sn-separating-children-psychology-20180620-story.html

https://www.newyorker.com/news/q-and-a/how-the-stress-of-separation-and-detention-changes-the-lives-of-children

https://www.pbs.org/wgbh/frontline/article/children-separated-from-their-parents-at-us-mexico-border-showed-increased-signs-of-post-traumatic-stress-us-report-says/

https://www.cbsnews.com/news/faces-of-family-separation-cbsn-originals/

Live web Final Project: Breathe with me

Breathe with me is a project developed to be placed in the Multi Sensory room, located in the NYU Dentistry Oral Health Center for People with Disabilities. The goal of this project is to propose a new artifact that can be placed in the room. The group has decided to focus on the tactile sense as a priority because there is a lack of those applications in the room and therefore we would like to propose a design that will provide a calming and relaxing experience by using the tactile sense and maybe the visual and sound senses as a secondary output.

Project Definition

Primary Population For Whom the Device is Being Developed: Adult patients of the NYU Oral Health Center for People with Disabilities who might have the following:

  • Anxiety/stress

  • Sensory Processing issues (Autism, ADHD, etc)

Secondary Population: Caregivers of the patients of the dentist’s office, staff of the office

Purpose of the Device: Calming tactile interface for patients who are waiting for their oral procedures and their caregivers. This device will be portable so it can be used inside the multisensory room and also it will be possible to use in the waiting area as a way of inviting both patients and caregivers to use the multi-sensory room. The device is designed to be placed in the lap of the user so it will be accessible to everyone including people in wheelchairs.

Research

  • Common relaxation strategies

Evidence-based stress management techniques include progressive muscle relaxation, autogenic training, relaxation response, biofeedback, guided imagery, diaphragmatic breathing, transcendental meditation, cognitive behavioral therapy, mindfulness-based stress reduction, and emotional freedom technique.

Varvogli, L. & Darviri, C. (2011). Stress Management Techniques: evidence-based procedures that reduce stress and promote health. Health Science Journal, 5(2): 74-89.

“One hundred undergraduates were randomly assigned to one of five treatment groups: (1) progressive muscle relaxation (PMR); (2) distraction imagery; (3) focused imagery; (4) listening to music; (5) sitting quietly (control). Distraction imagery and listening to music were the only techniques found to reduce anxiety to a greater extent than simply sitting quietly.”

Avants, S.K., Margolin, A., & Salovey, P. (1990). Stress Management Techniques: Anxiety Reduction, Appeal, and Individual Differences. Imagination, Cognition and Personality, 10(1): 3-23. https://doi.org/10.2190/WDH5-GEV3-YT3C-95NY

  • Relaxation strategies in the dentist clinic

“The most common strategies used by dentists in this study were: permitting the child to exercise some form of control over terminating the treatment, if they were experiencing difficulties; furnishing waiting areas with play materials; and using a Tell-Show-Do approach to the provision of dental care. Members of the Australian Society of Dentistry for Children differed from general dentists by more frequently teaching anxious children a technique of relaxation and also by more frequently using a mouth prop or rubber dam during the delivery of care.”

“There is evidence that focusing attention on specific alternative visual or auditory stimuli in the dental clinic might be beneficial for patients with mild to moderate dental anxiety… Both visual and auditory distraction is now available through the use of goggles capable of showing 2D and 3D vision accompanied by surround sound… More research is required to explore whether the effectiveness of this type of distraction is perhaps dependent on patient‐related factors, such as personality attributes related to desire for predictability or control. There is evidence, however, that audiovisual distraction might be beneficial for children who are anxious or uncooperative in the clinic.”

Wright, F.A., McMurray N.E., & Giebartowski, J. (1991). Strategies used by dentists in Victoria, Australia, to manage children with anxiety or behavior problems. Asdc Journal of Dentistry for Children, 58(3):223-228.

“Distraction techniques have been found to reduce dental anxiety. Such techniques may include playing video games, watching videotapes, or listening to music.”

Biggs, Q.M., Kelly, K.S., & Toney, J.D. (2003). The Effects of Deep Diaphragmatic Breathing and Focused Attention on Dental Anxiety in a Private Practice Setting. The Journal of Dental Hygiene, 77(2), 105-113.

  • Deep breathing/visualization

“(Anxiety relief) can be achieved by both deep breathing and muscle relaxation. Once a person is physically relaxed, it is impossible to be psychologically upset at the same time.”

Appukuttan, D. (2016). Strategies to manage patients with dental anxiety and dental phobia: literature review. Clinical, Cosmetic and Investigational Dentistry, 35. doi: 10.2147/ccide.s63626

“One exercise which is believed to be of benefit to almost every fearful patient is relaxation through paced breathing. The physiologic changes accompanying relaxation breathing, or diaphragmatic breathing, effectively form a counterpart to, and are therefore incompatible with, the emergency ‘fight or flight’ reaction characterizing anxious individuals… There are several variations on relaxation breathing. For example, Milgrom et al. describe a procedure whereby patients are taught to take slow, deep breaths, holding each breath for approximately 5 seconds, before slowly exhaling. Slow, steady breathing for 2–4 minutes is regarded as effective in reducing a patient’s heart rate and making anxious patients noticeably more comfortable.”

Armfield, J.A., & Heaton, L.J. (2013). Management of fear and anxiety in the dental clinic: a review. (2013). Australian Dental Journal, 58(4), 531–531. doi: 10.1111/adj.12125

“In addition to a number of pharmacological and cognitive behavioral techniques, techniques that modify breathing also have been found to reduce dental anxiety. Breathing techniques are associated with reducing overall arousal, increasing a sense of well-being, and improving the body’s ability to cope with anxiety.”

Biggs, Q.M., Kelly, K.S., & Toney, J.D. (2003). The Effects of Deep Diaphragmatic Breathing and Focused Attention on Dental Anxiety in a Private Practice Setting. The Journal of Dental Hygiene, 77(2), 105-113.

  • Stress ball

“When you’re stressed, your body tightens up – so a physical release helps to let go of some of that energy… The benefit of squeezing is that it releases some kind of energy – it also induces you to relax.”

Do stress balls really work? (2017, June 15). Retrieved from https://www.brownmed.com/uncategorized/do-stress-balls-really-work/.

“Strategies to improve dental visits for people with ASD include modifying the environment and sensory intervention strategies. One example of sensory intervention strategies is using heavy work… Heavy work includes any activity that provides resistance to the muscles and joints of the body. Activities such as pushing or pulling something heavy, jumping, lifting or carrying heavy items, or squeezing something against resistance can all be considered heavy work.”

Kuhaneck, H. M. and Chisholm, E. C. (2012). Improving dental visits for individuals with autism spectrum disorders through an understanding of sensory processing. Special Care in Dentistry, 32: 229-233. doi:10.1111/j.1754-4505.2012.00283.x

“Preliminary findings from a study of children with attention deficit hyperactivity disorder (ADHD) show that sensory intervention — for example, deep pressure…– can significantly improve problem behaviors such as restlessness, impulsivity and hyperactivity.”

Temple University Health Sciences Center. (2005, May 13). Study Finds ADHD Improves With Sensory Intervention. ScienceDaily. Retrieved December 10, 2019 from www.sciencedaily.com/releases/2005/05/050513103548.htm

“In a study comparing relaxation techniques to reduce anxiety in a patient with mild mental retardation, it was found that the use of a gel-filled squeeze ball was effective in reducing anxiety. This was demonstrated by a decrease in heart rate from baseline. This conclusion is similar to the other studies. ”

Kenner, C. C. (2009). Comparison of Two Relaxation Techniques to Reduce Physiological Indices of Anxiety in a Person with Mild Mental Retardation. Thesis. https://pdfs.semanticscholar.org/5392/c0c59fd4c5ecbab5bdcdb031b9fd466cf660.pdf

  • Lights

Snoezelen SDE consisting of a partially dimmed room with lighting effects, vibroacoustic stimuli, and deep pressure demonstrated an important potential effect on the relaxation of children during dental hygiene care

Shapiro, M., Melmed, R. N., Sgan‐Cohen, H. D., Eli, I., & Parush, S. (2007, November 19). Behavioural and physiological effect of dental environment sensory adaptation on children’s dental anxiety. Retrieved from http://onlinelibrary.wiley.com/doi/10.1111/j.1600-0722.2007.00490.x/abstract.

  • Sound

The most relaxing song in the world: “‘Weightless’ by Marconi was able to induce greater relaxation levels in participants than a

massage (increase of 6%). ‘Weightless’ also induced an 11% increase in relaxation over all other relaxing music tracks.”

A Study Investigating the Relaxation Effects of the Music Track Weightless by Marconi Union in consultation with Lyz Cooper. PDF. (n.d.). Brighton.

Passman, J. (2017, February 8). The World’s Most Relaxing Song. Retrieved from https://www.forbes.com/sites/jordanpassman/2016/11/23/the-worlds-most-relaxing-song/#6f46dccf2053.

Process

The project started with the connection between the physical computing and the visual and auditory output.

Live Web Final Project Proposal

For my final I am thinking about pursuing two different ideas which I am going to explain deeper in detail:

1. PT live video interface to guide and encourage patients to do their exercises

For my midterm assignment, I already started working around this idea of having a platform that will enable PT to guide their patients while they perform certain exercises. The main pain point that I would like to work on is the fact that patients lack motivation to perform their exercises, therefore, their condition gets worse over time.

I would like to create a platform in which the PT can track the progress of the user and have a way to motivate them by recording the videos of the first visits and be able to record short videos of their next appointments so that they can compare the progress over time.

This would be a continuation of my midterm assignment but this time I would like to be able to:

  1. Collect data about the exercises performed.

  2. Record short videos of the patient’s progress.

  3. Be able to have a more intuitive and user-friendly interface.

2. Stress ball with breathing exercises app

For my “Developing Assistive Technologies” class I am designing an element that can be placed in the NYU Oral Health Center for People with Disabilities who might have Anxiety/stress and/or Sensory Processing issues (Autism, ADHD, etc).

Purpose of the Device: Calming tactile interface for patients who are waiting for their oral procedures and their caregivers. This device will be portable so it can be used inside the multisensory room and also it will be possible to use in the waiting area as a way of inviting both patients and caregivers to use the multi-sensory room. The device will be designed to be placed in the lap of the user so it will be accessible to everyone including people in wheelchairs. 

Live Web Portion: By doing user testing of the first prototype of the device I have received feedback that this device might benefit from some guidance for the user to calm down, I would like to connect the stress ball to a visual interface that will allow the patients (or a user with stress or anxiety) to follow breathing patterns.

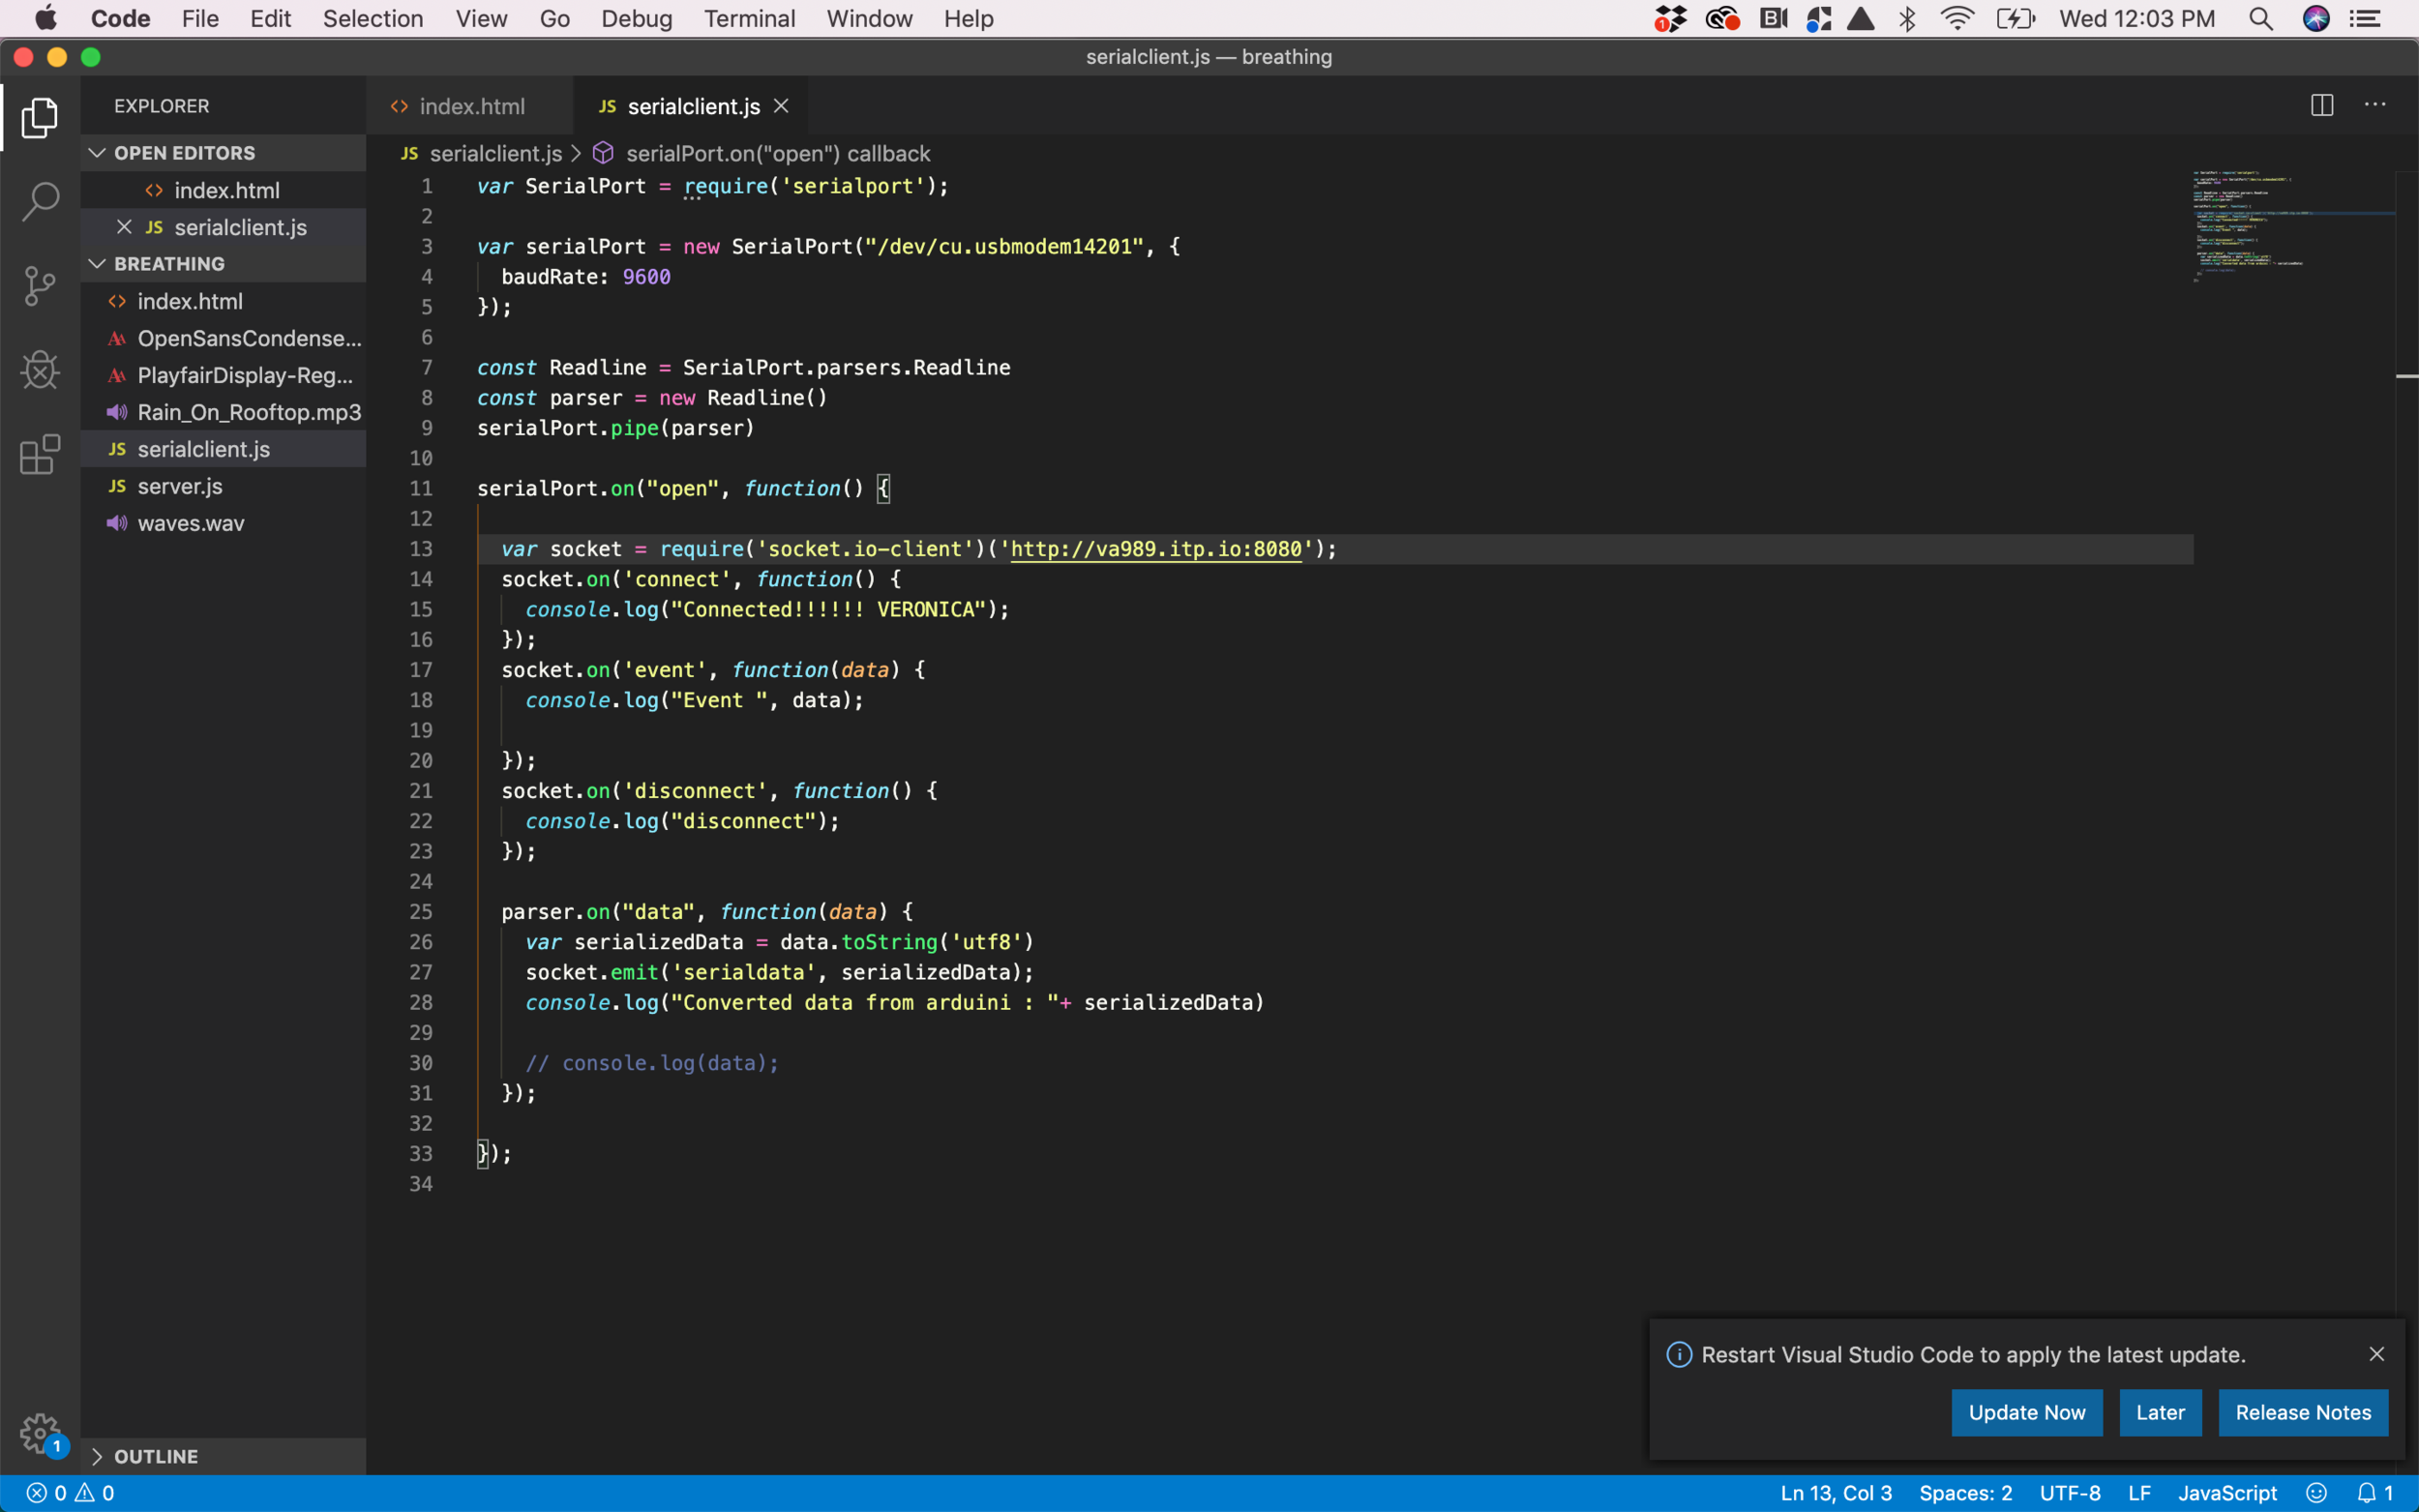
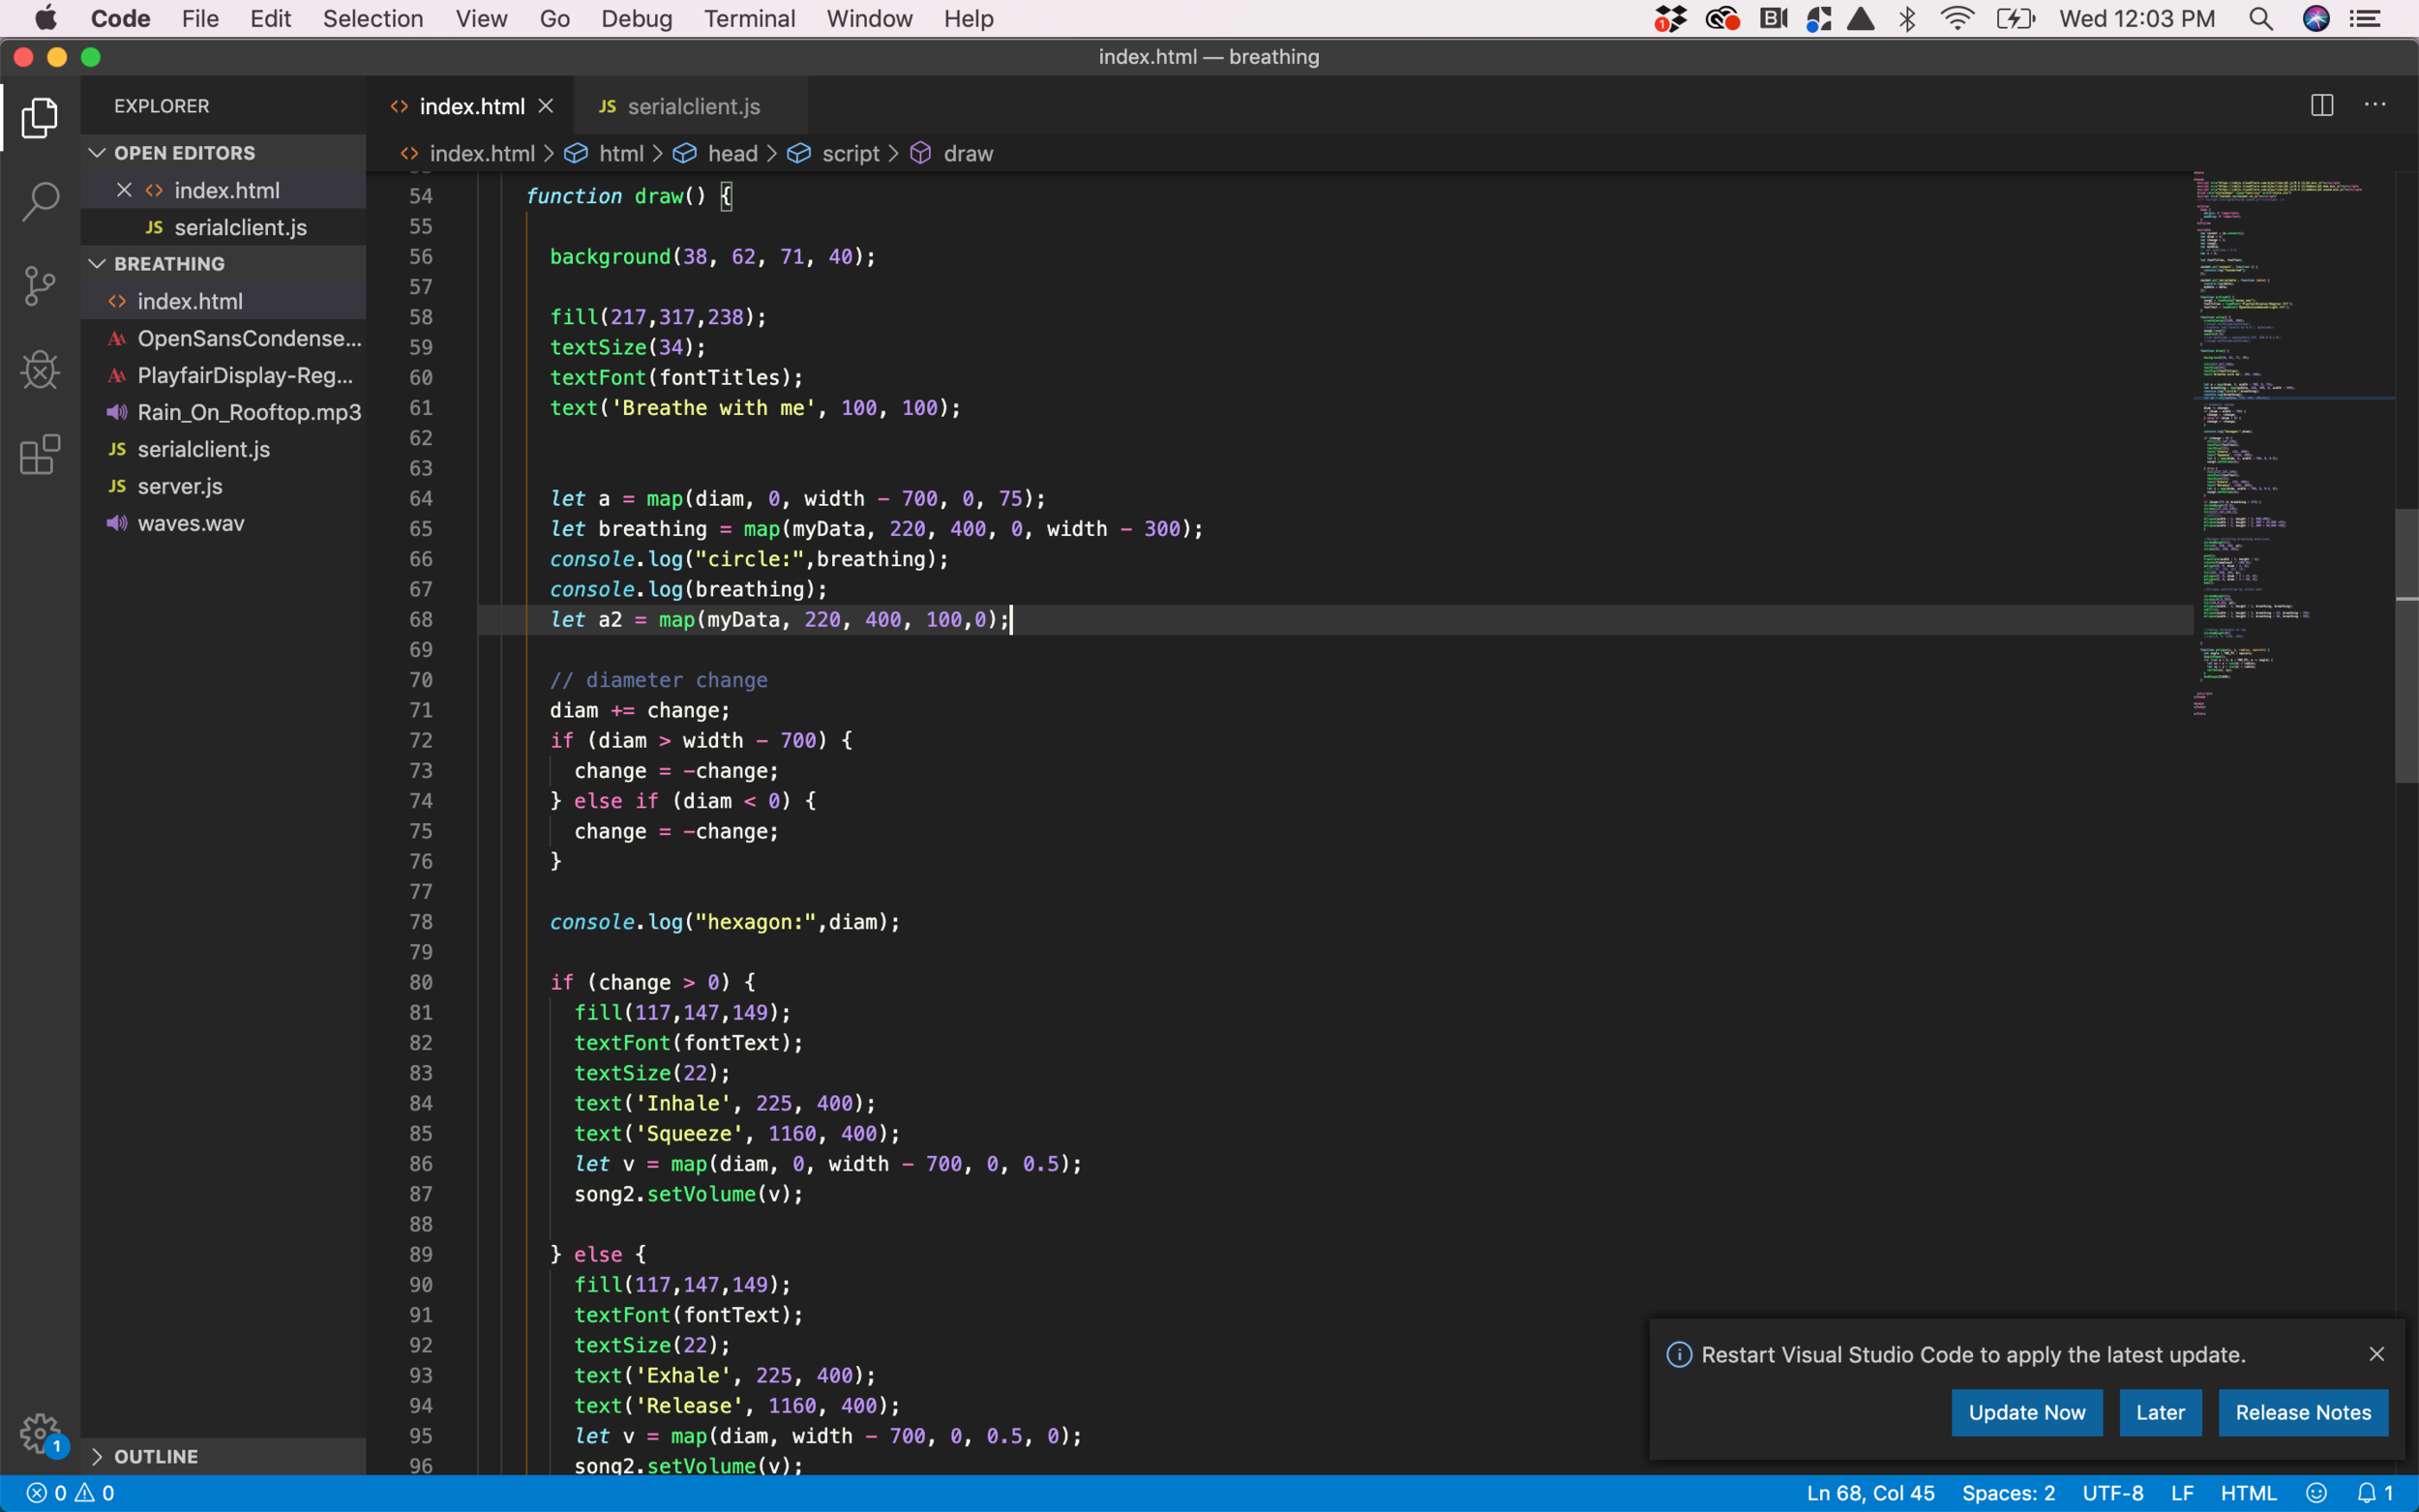
The website will have a breathing pattern that will be shown with a circular relaxing pattern in the screen when the circle gets bigger is time for the user to inhale, when the circle gets smaller, it’s time to exhale. The pattern will be calming and the rate of the breathing will be slow so that the users can relax. At the same time that the breathing visuals are happening the user will be prompted to squeeze the ball, which is covered by resistive fabric, which sends values to Arduino, I will define a threshold so that when the ball is squeezed when inhaling, the visual interface will have an indicator that the user achieved the breathing correctly.

The following is a video of the way the first prototype is working:

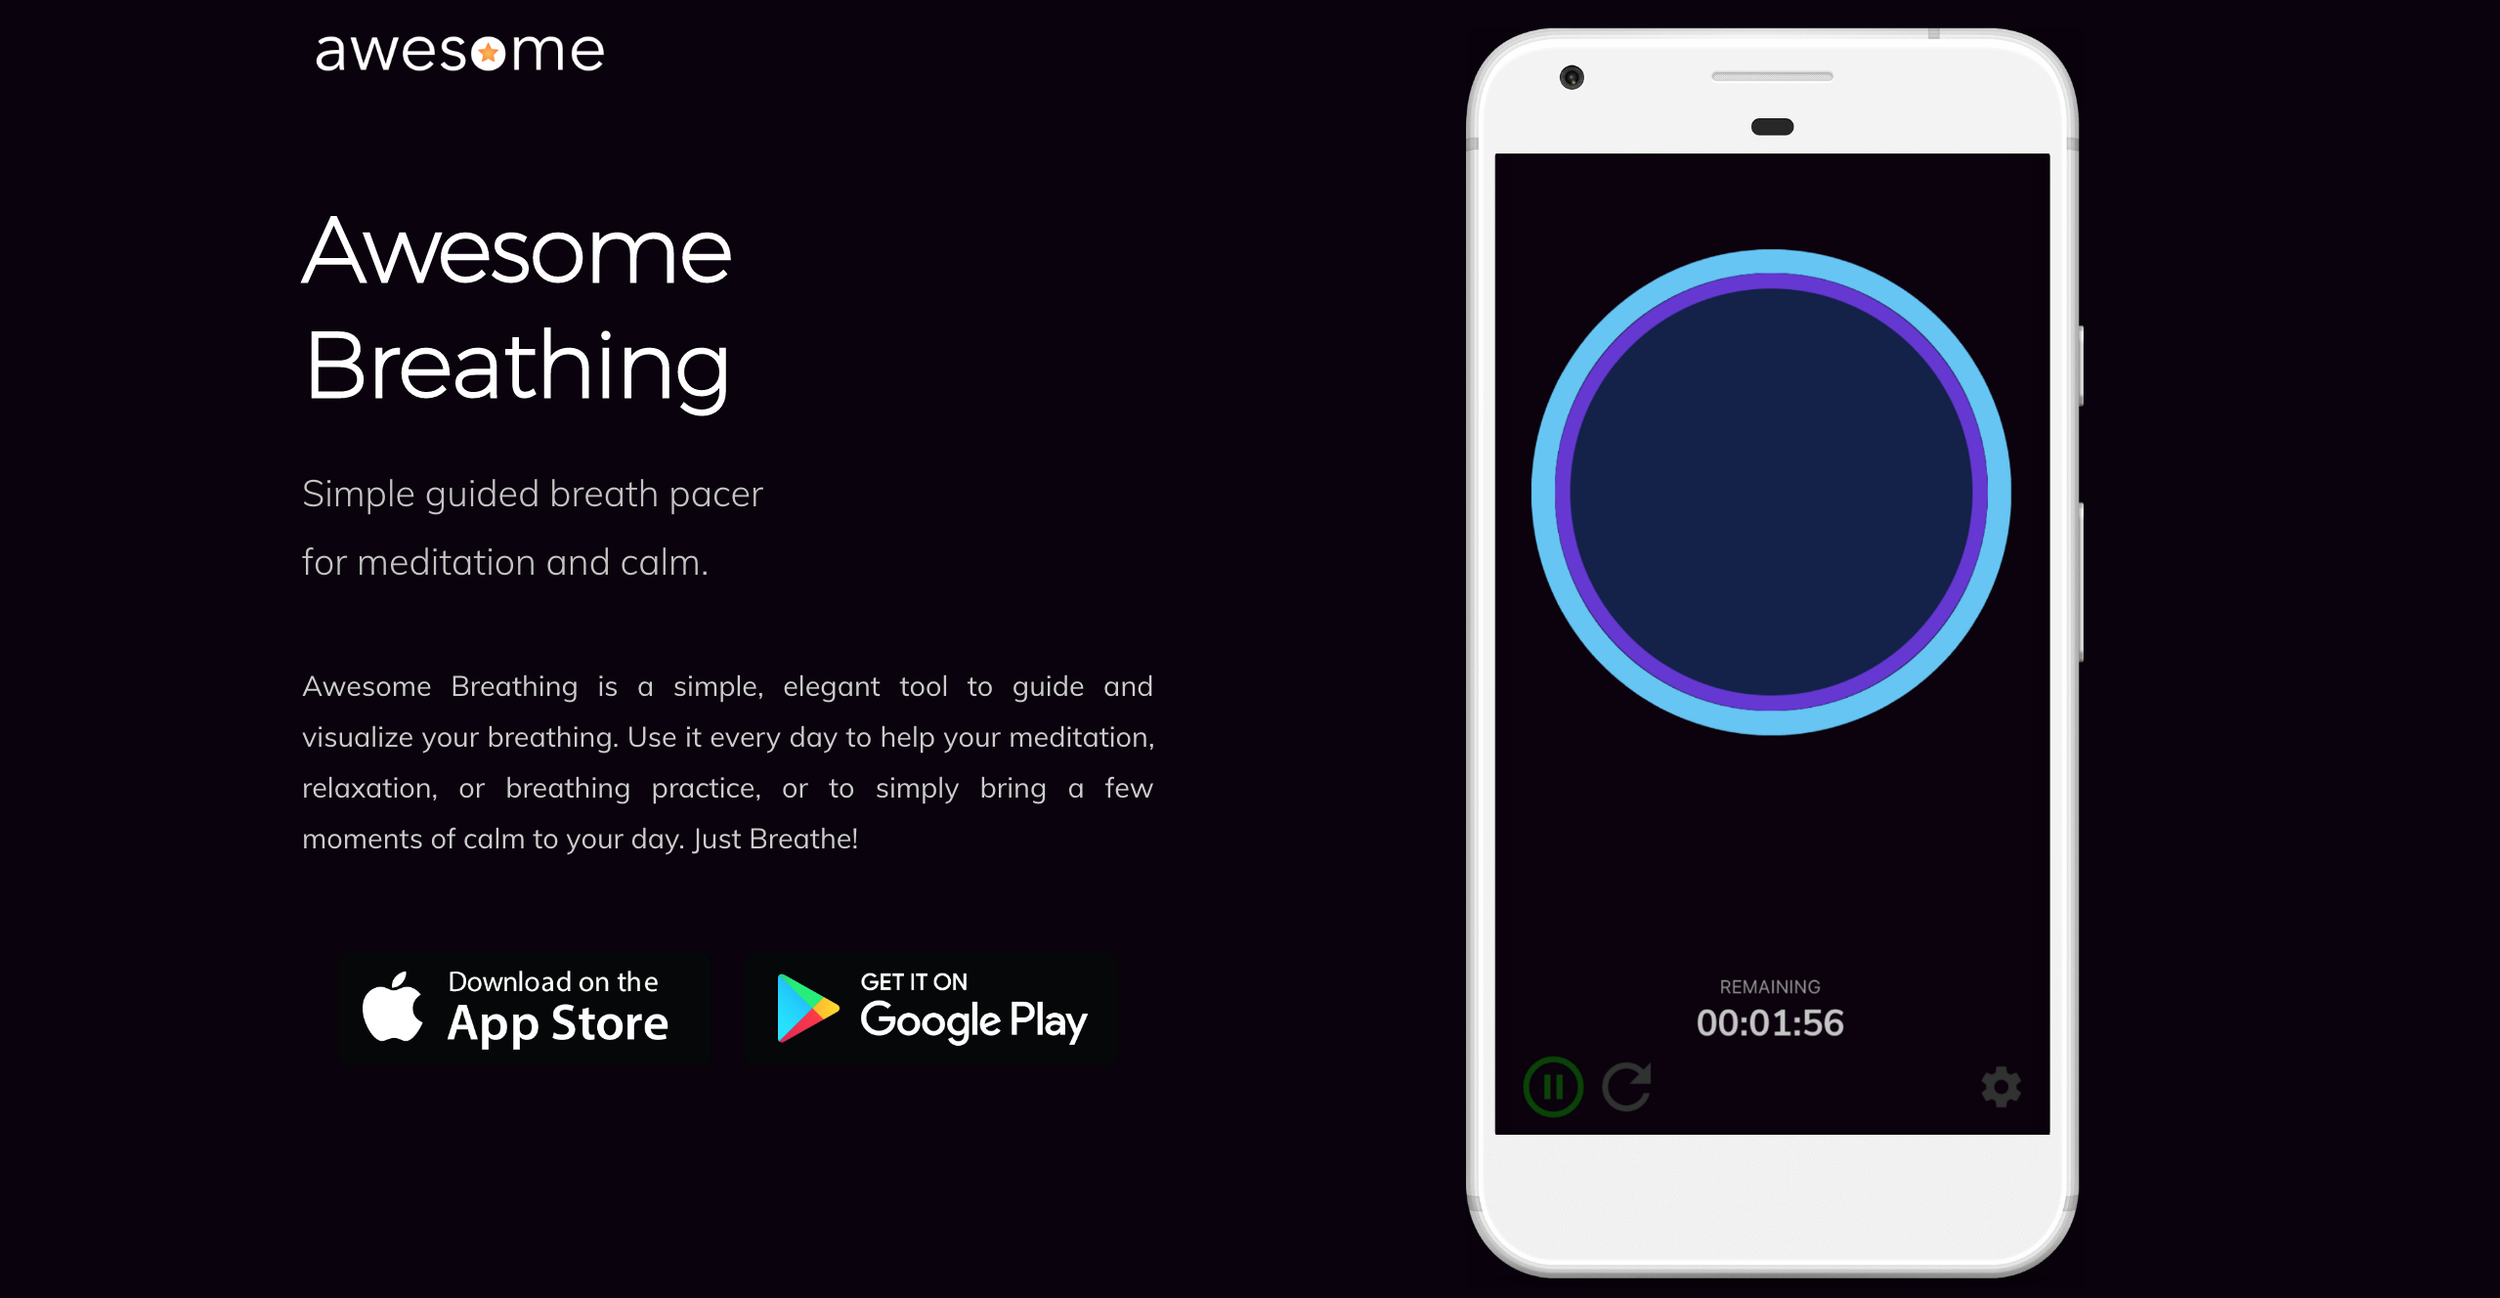
As an inspiration I would like to use apps like Calm that guides the user to breathe in certain patterns, however this will have a tactile interface connected to the UI so that the user follows the breathing exercises with the squeeze interaction for the stress ball in order to calm them down.

Inspiration from Calm App

The following is a visual explanation on how the stress ball will be connected to the visual patterns in the screen:

Stress ball conncented to the computer

Stress ball conncented to the computer

Visuals interaction

Visuals interaction

Data Publics: Micro-Mapping nicotine addiction

For the Data Publics assignment, I decided to combine this project with my Citizen Science project, this is ongoing research and scientific project in which I want to use data visualization in order to show the genetic sequencing and correlate to a specific location in the map.

The experiment consists on a speculative piece in which I collect cigarette butts from the streets of midtown Manhattan, specifically, 5 cigarette butts collected in a 5 blocks walk from my office to the train station. The goal of the collection is to be able to identify which of these people who were smoking had genetic predisposition to be addicts to nicotine.

I decided to correlate each address (from where I picked up each of the cigarette butts) to each specific “stranger” and the goal of the continuation of this project is to be able to display as an overlay in the map a visualization of the AGTC code for each mutation identified in each person’s DNA.

Lab 3: Final Project

For the final project I decided to work on a prototype for my “Developing Assistive Technologies” class, I have been very interested in using technology and design in order to improve the living conditions of people with disabilities and this was a good project to prototype some of these solutions.

The project consists on a new element that will be placed in the Oral Clinic for people with disabilities in the NYU Dentistry College, they have a multi-sensory room which main goal is to provide different stimuli for people with different disabilities who come to the oral center and they are feeling nervous about the procedures that are about to receive.

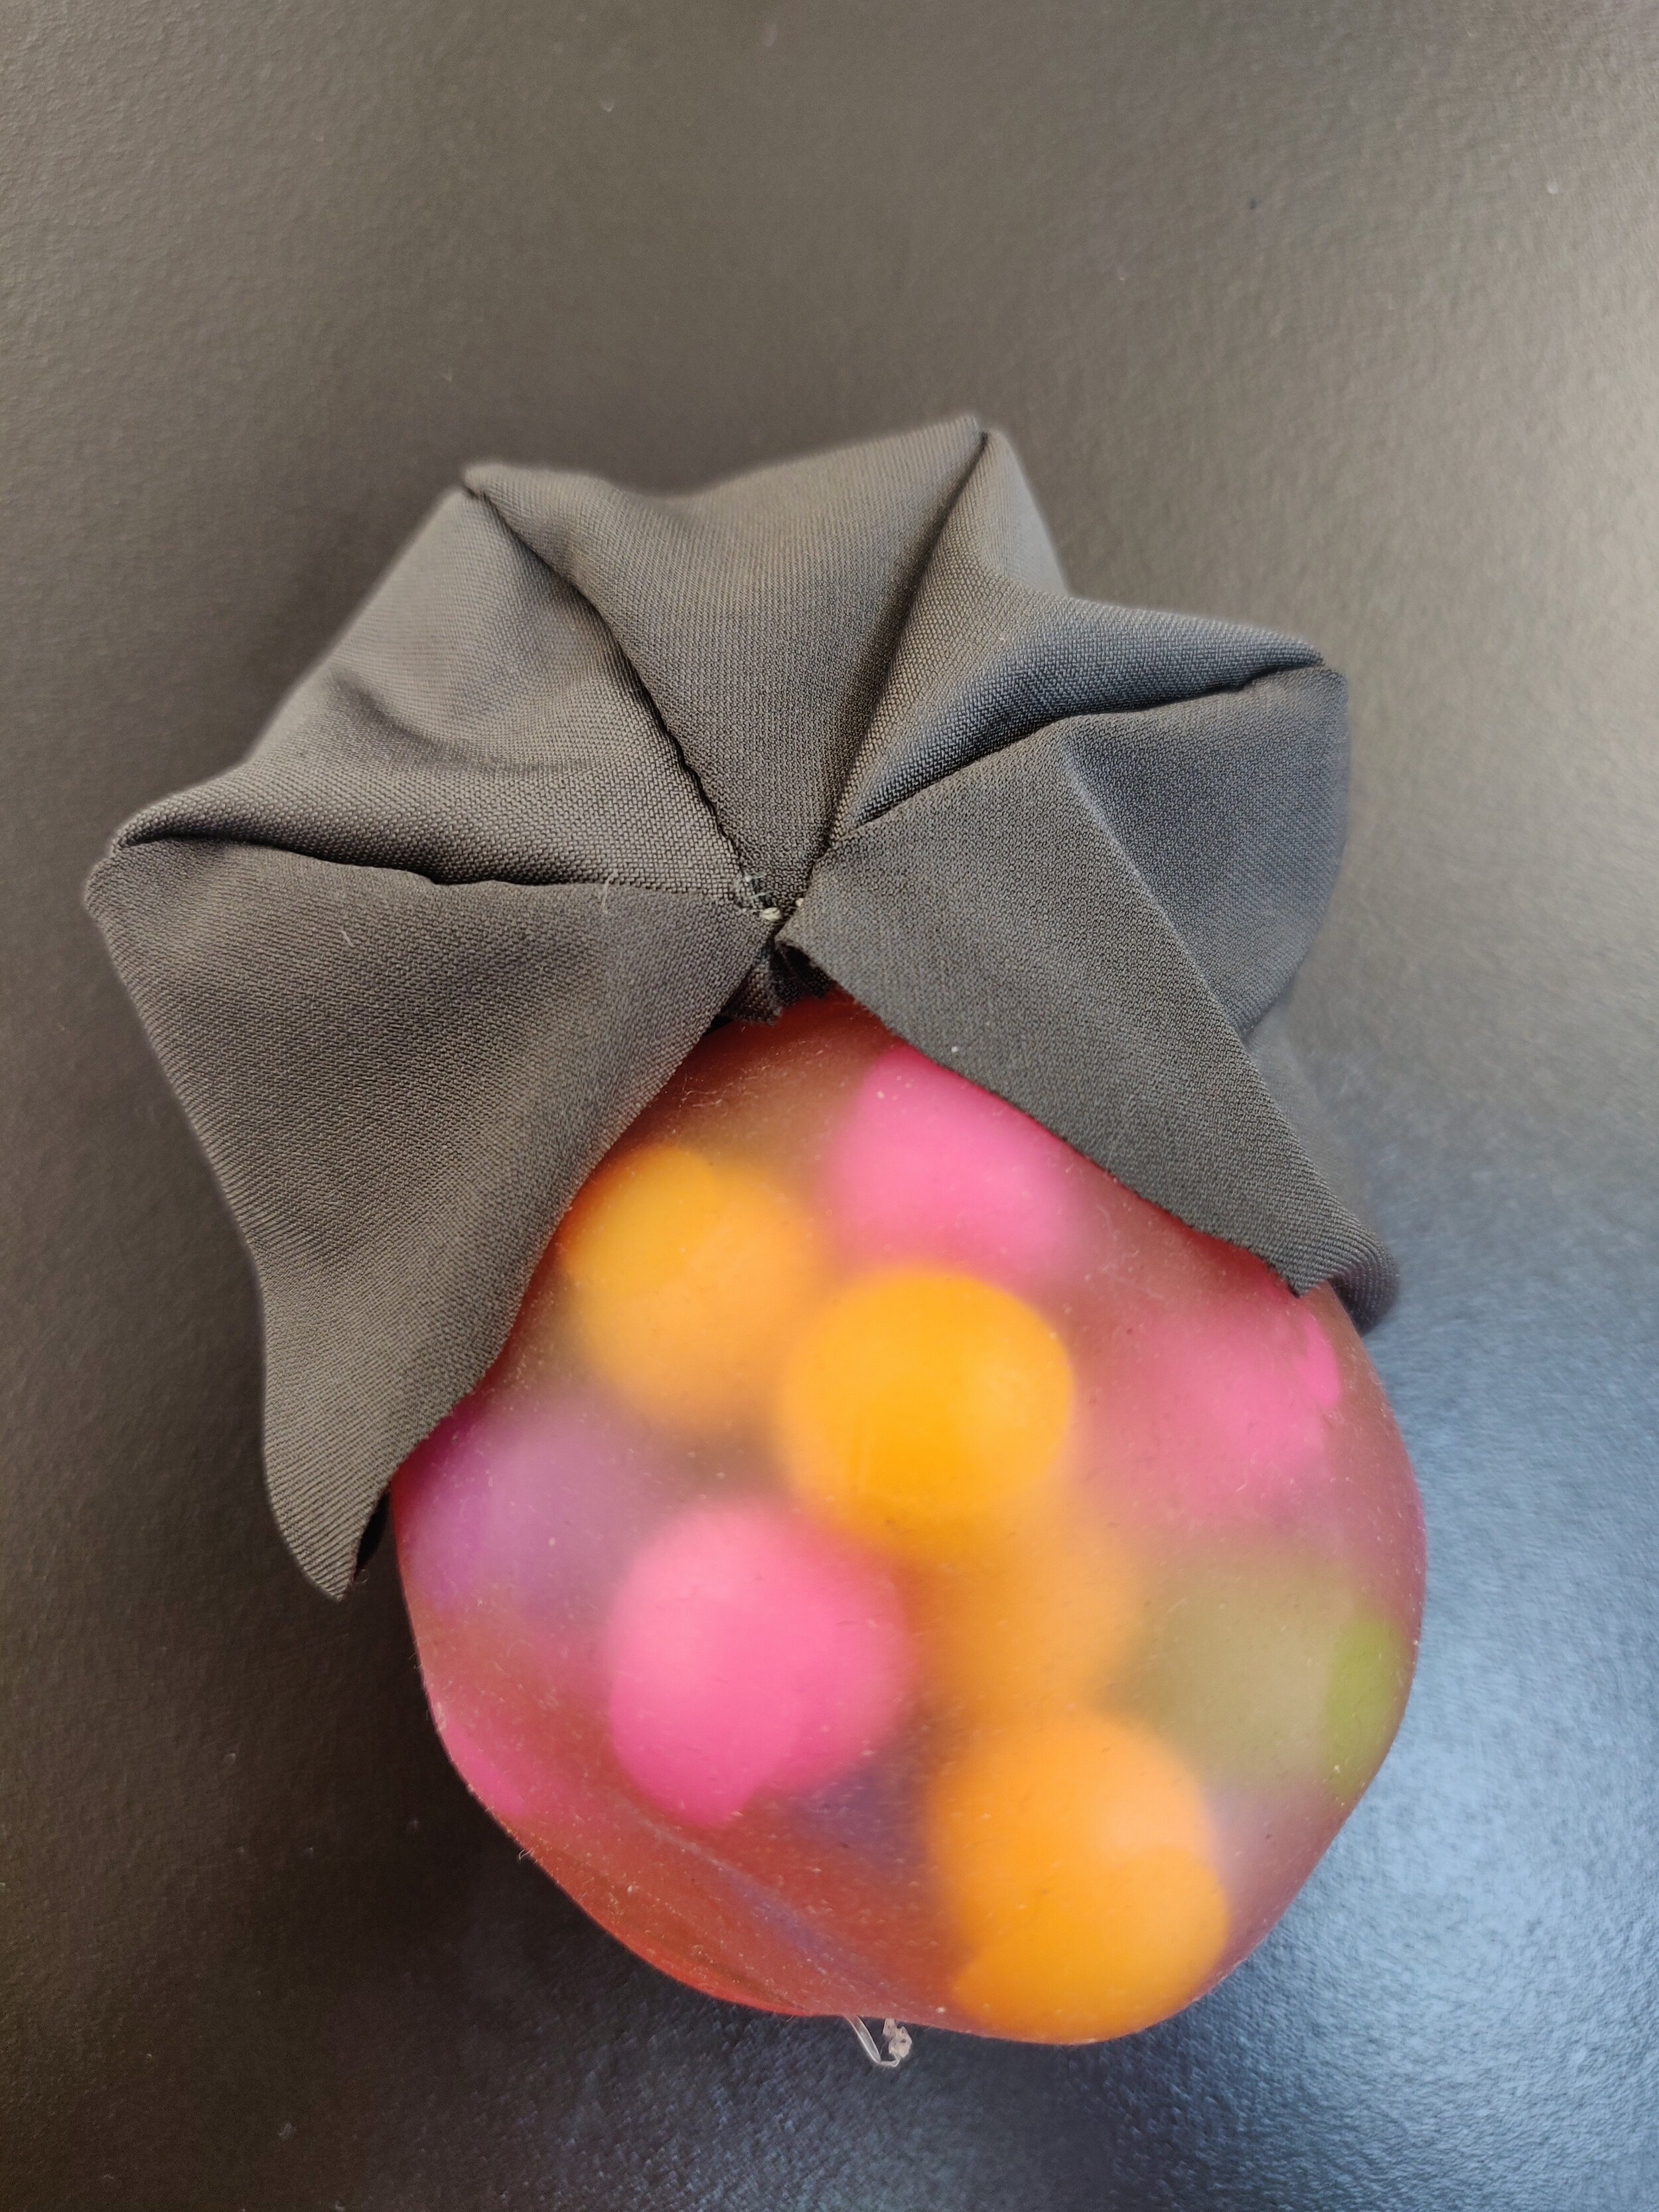
The proposal for this room is to have something that is more targeted for the tactile sense, I wanted to use a stress ball as a base, which already contains an interesting interface since it’s filled with bubbles and as the user squeezes the ball, some elements in the room are going to change, for example the luminosity in some of their light interfaces and also some of the graphics that are displayed on the projections could be changed according to how much the user squeeze the ball.

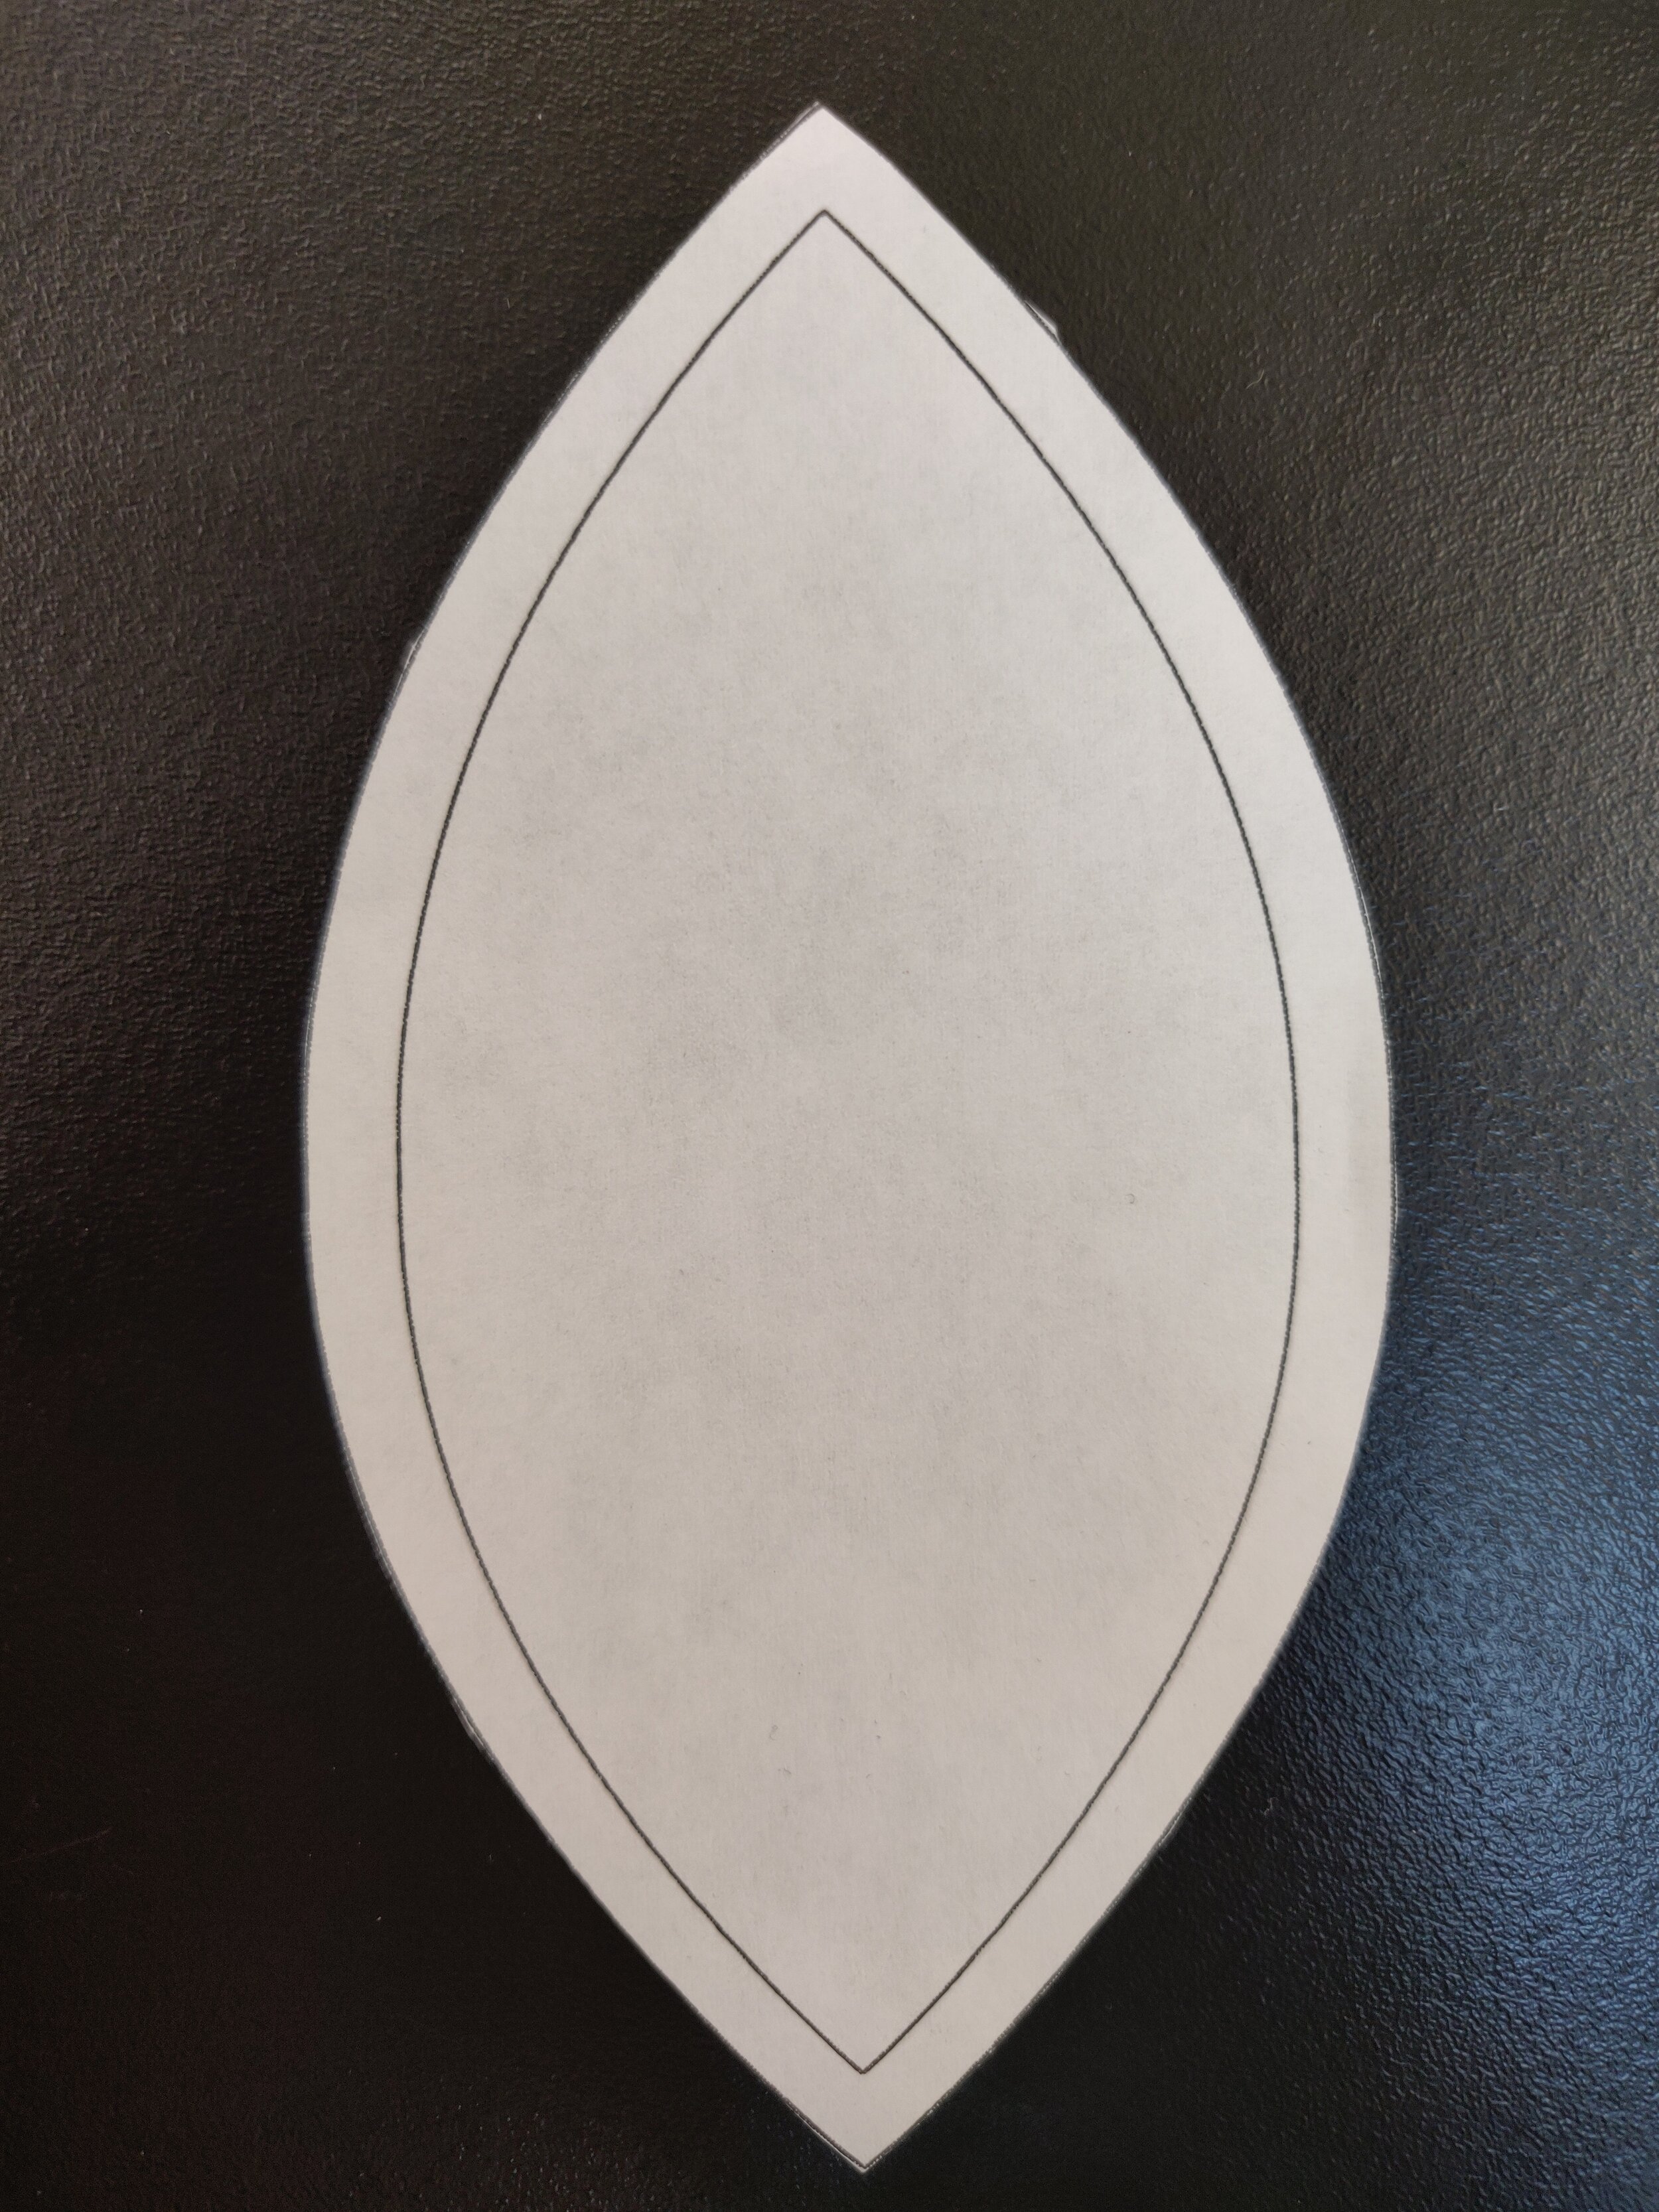
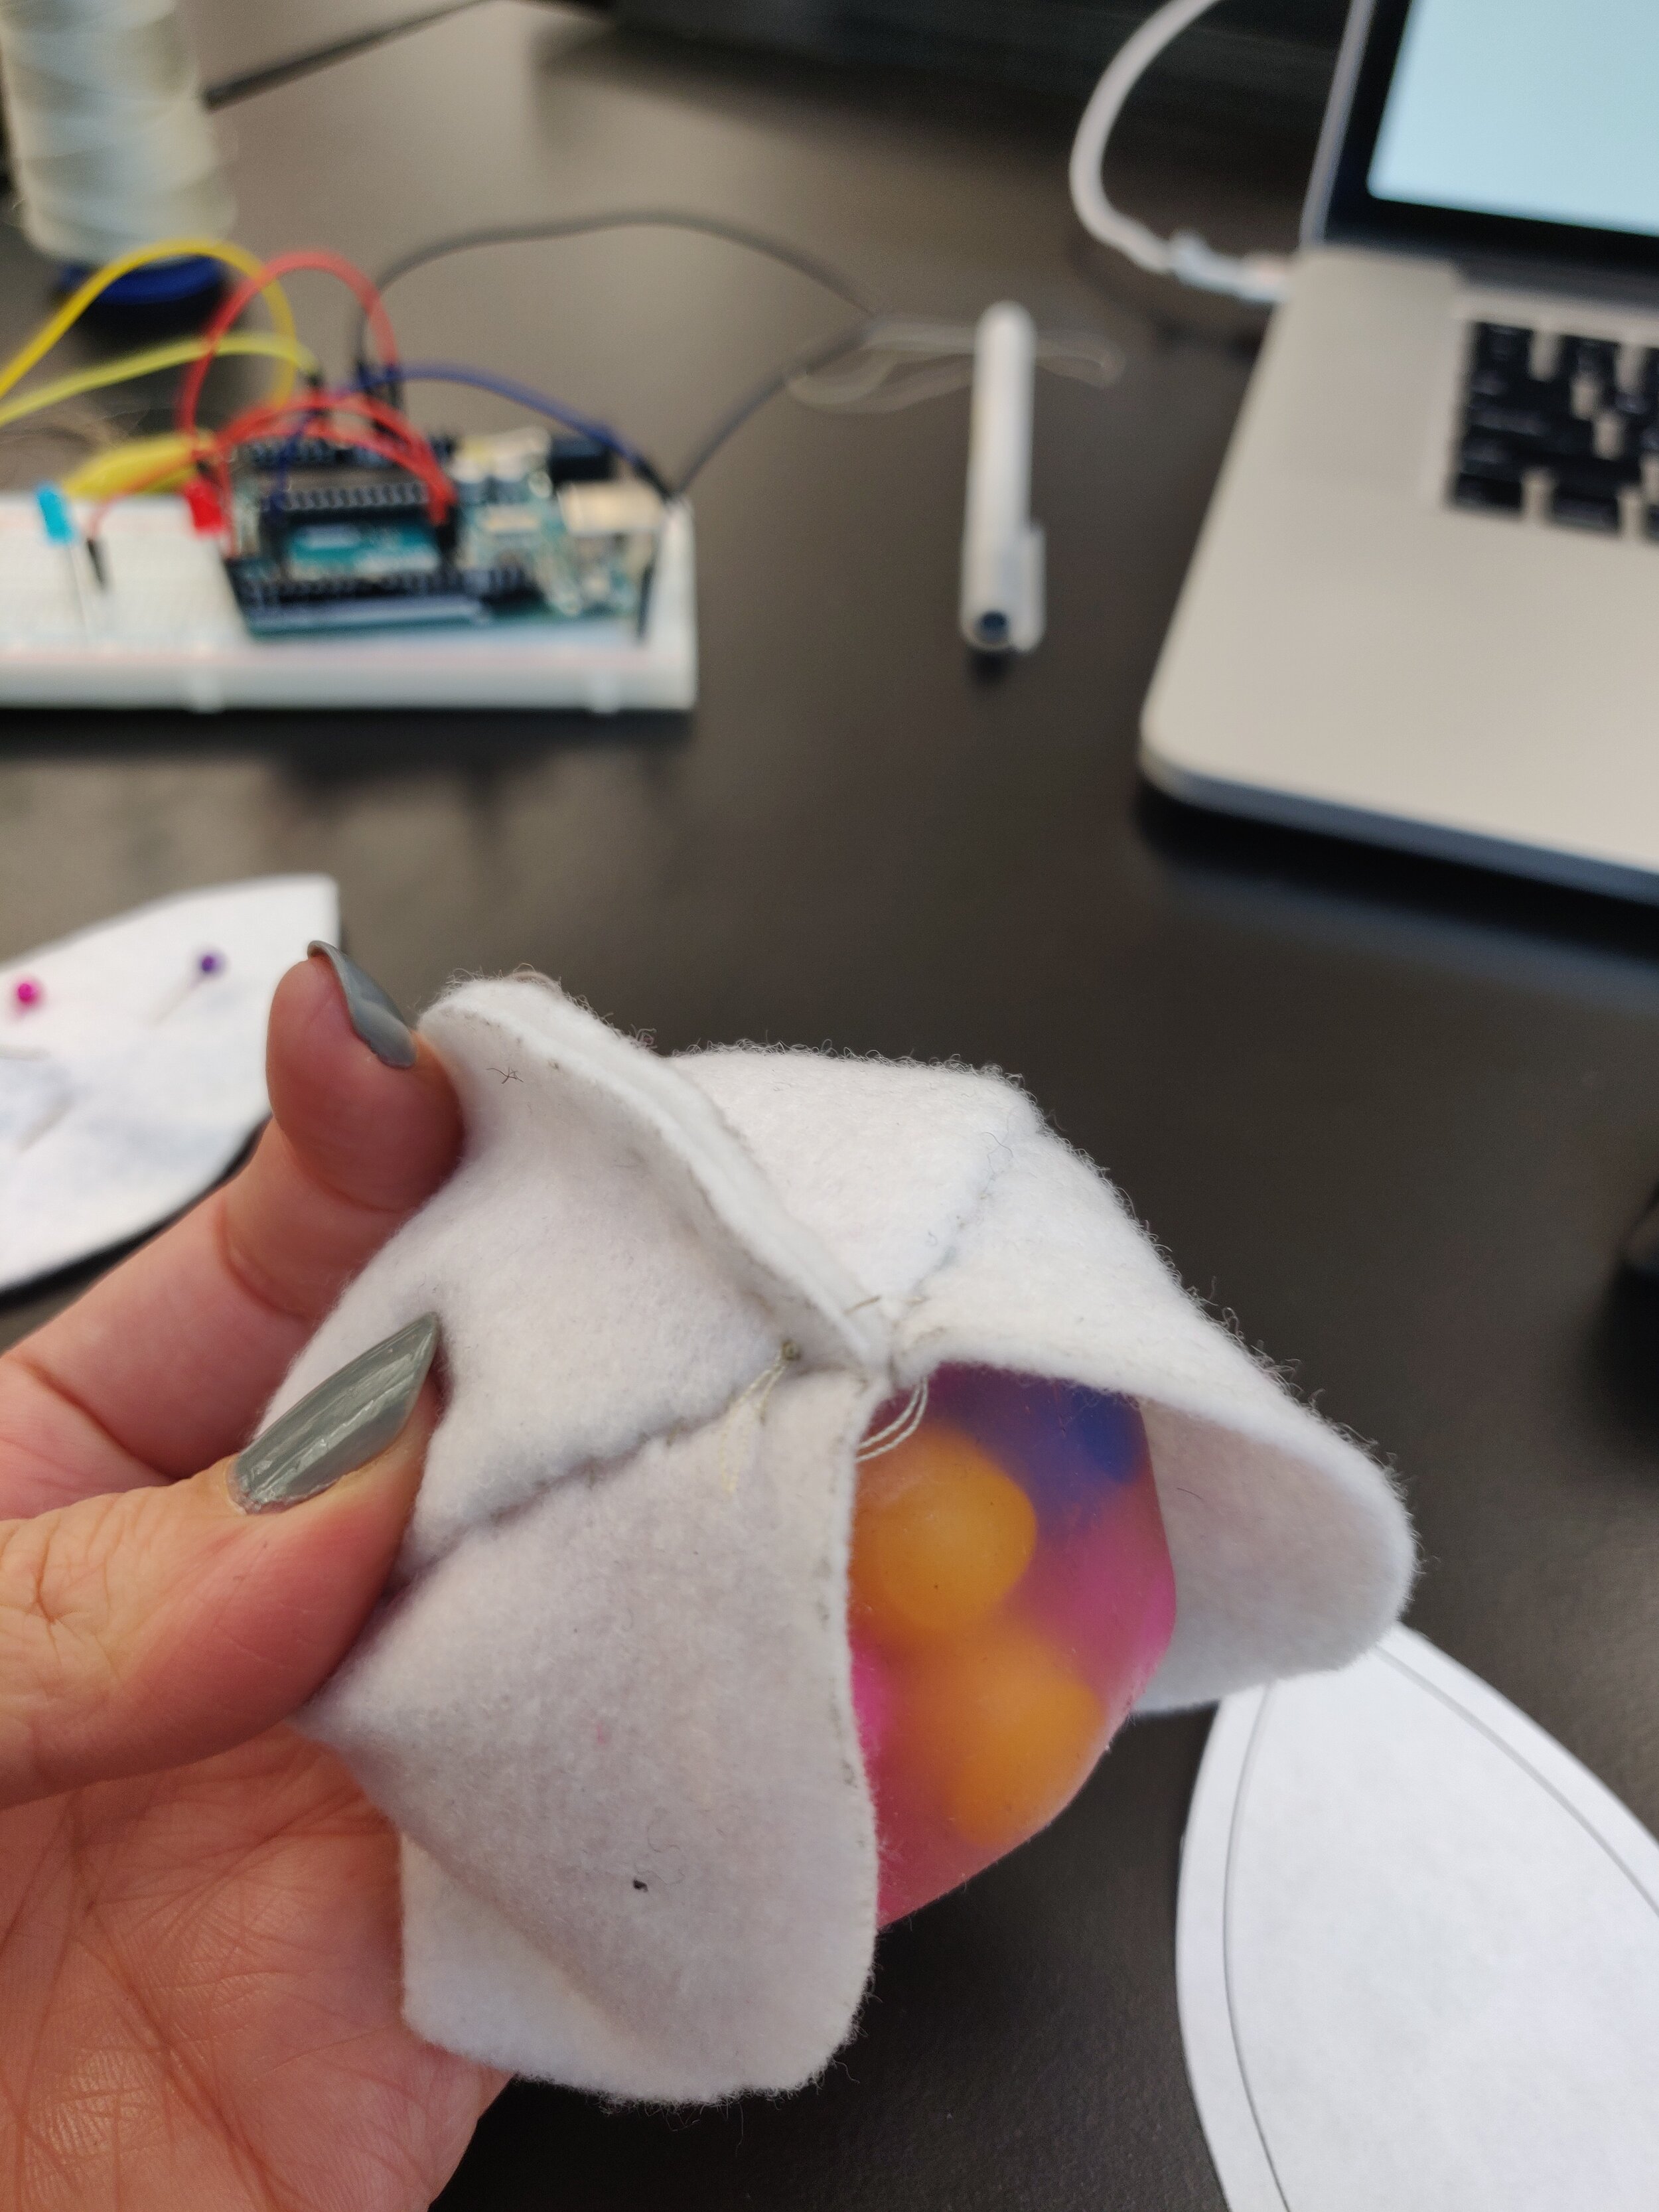
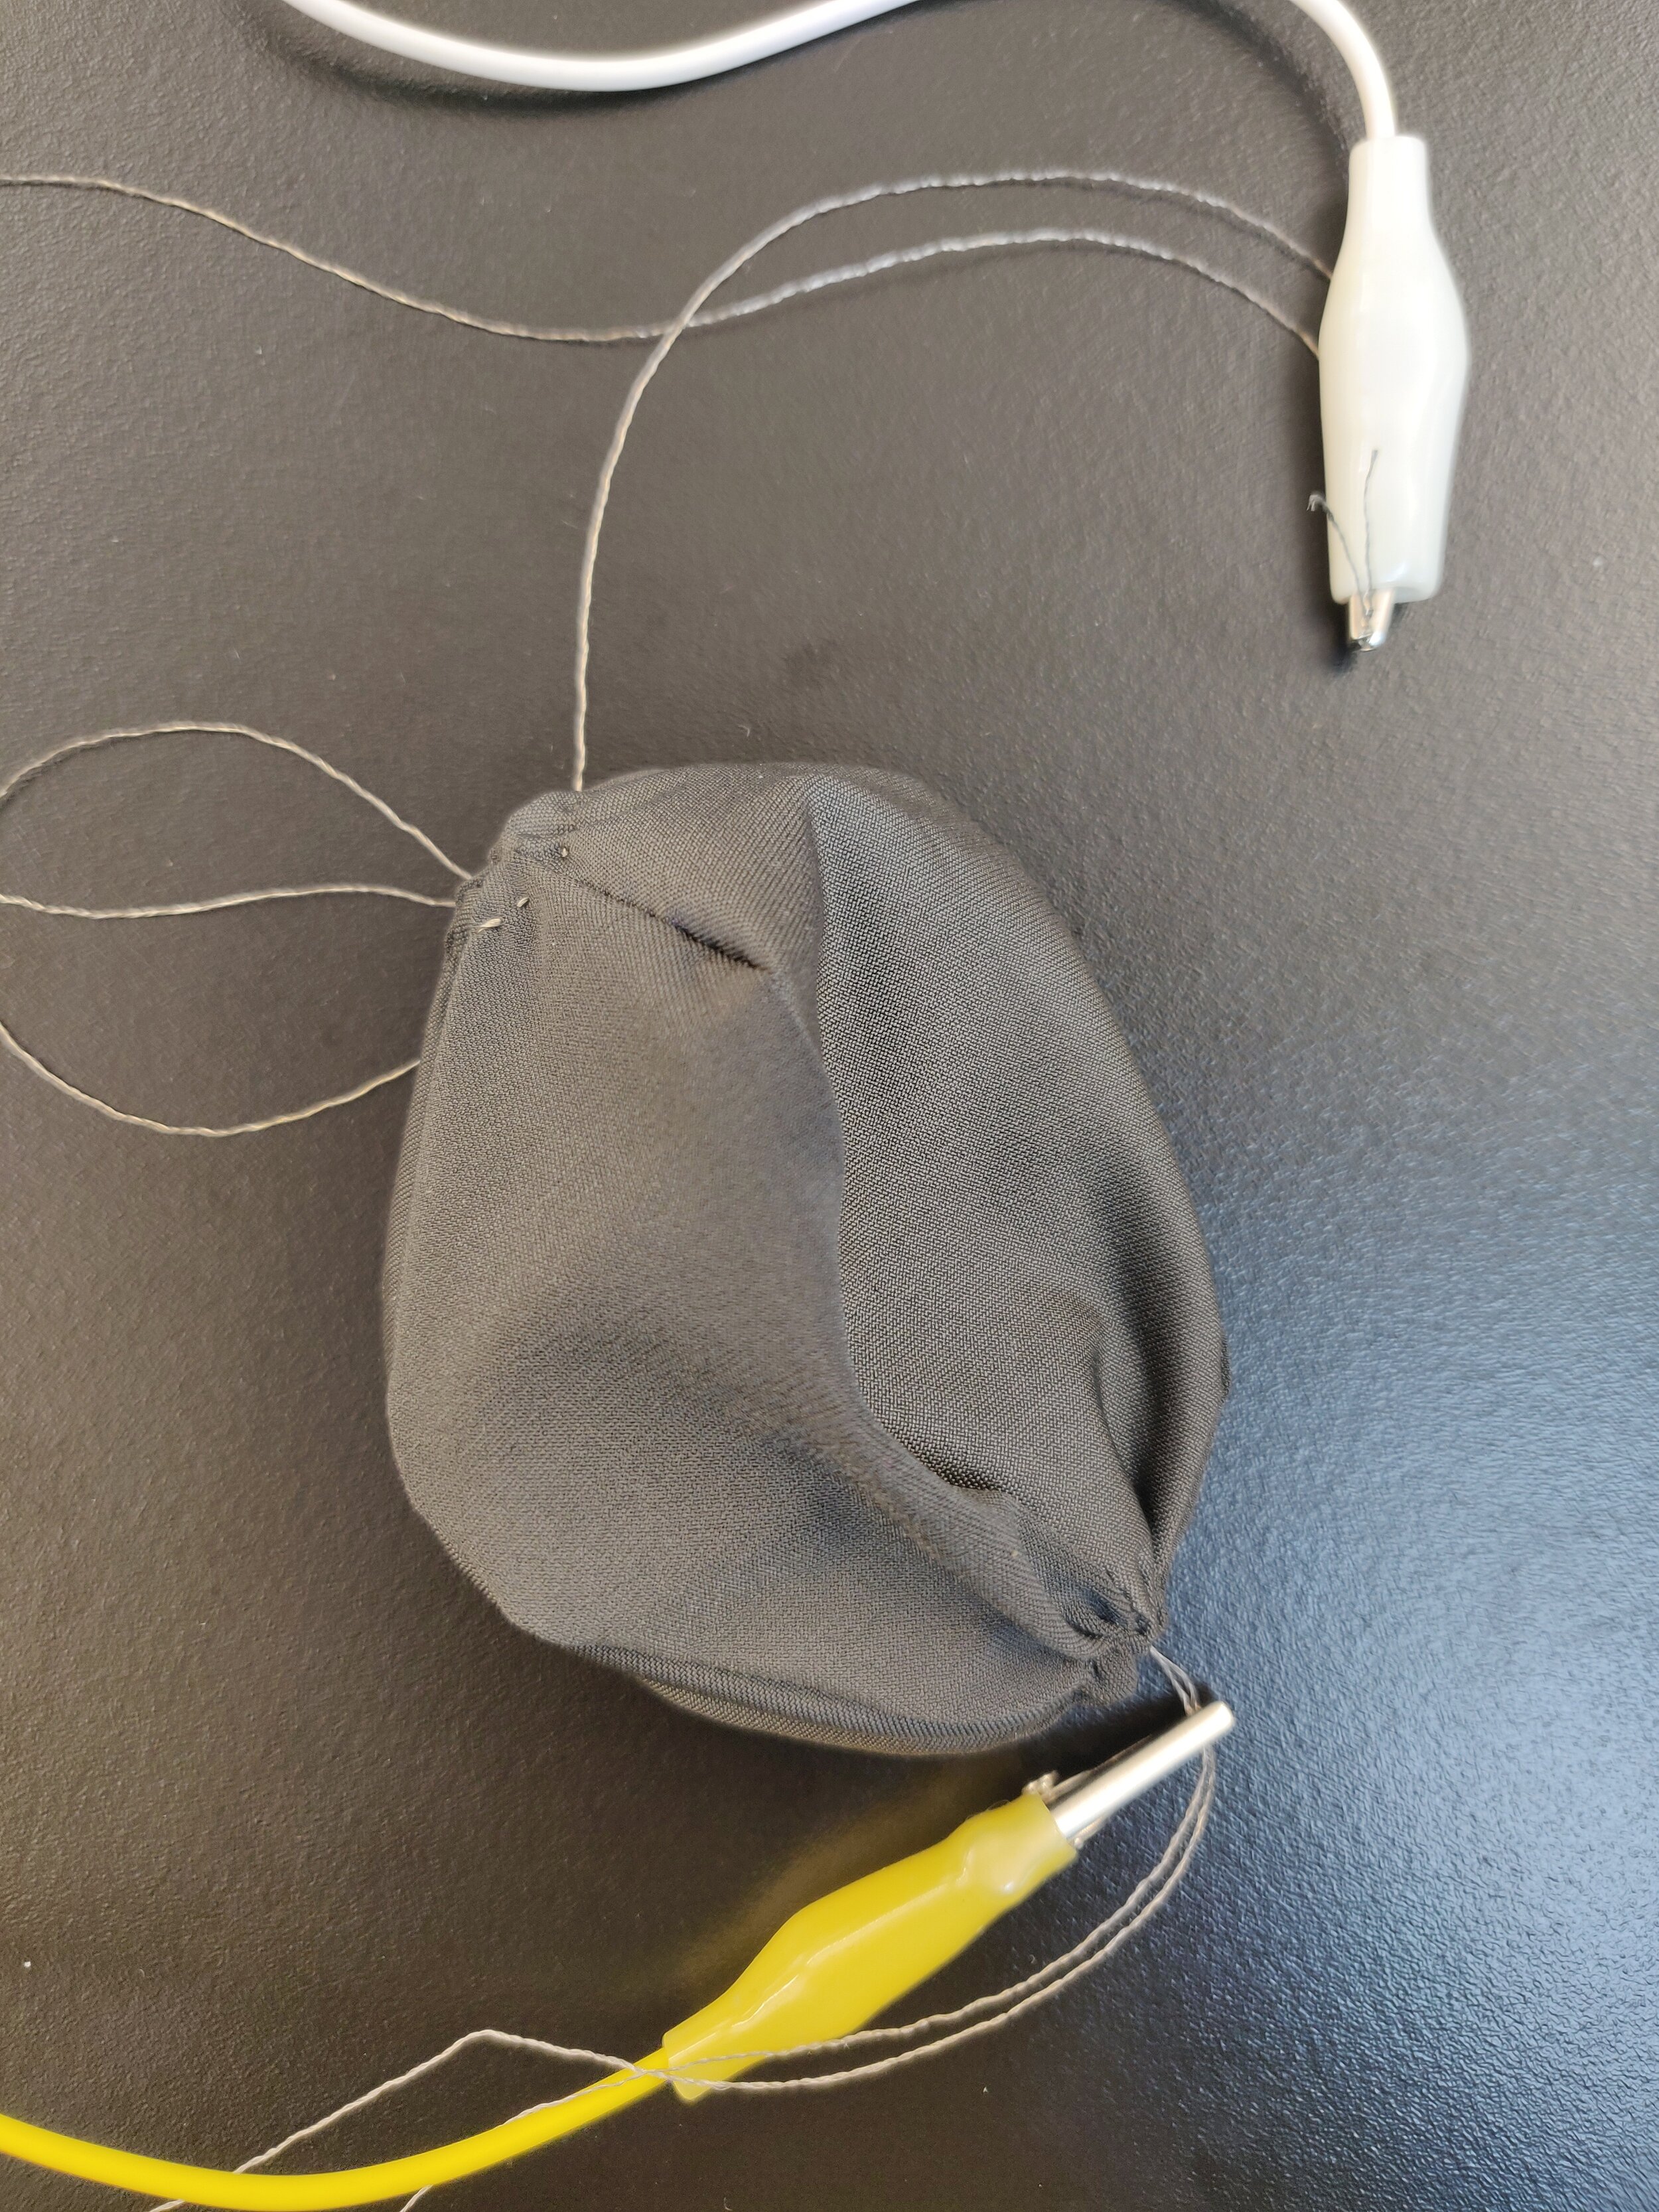
For this prototype I started by finding a pattern for the sphere and how to cover it in fabric, I used some template that I found online and followed it first with felt so that I could practice and make sure that the dimensions were correct.
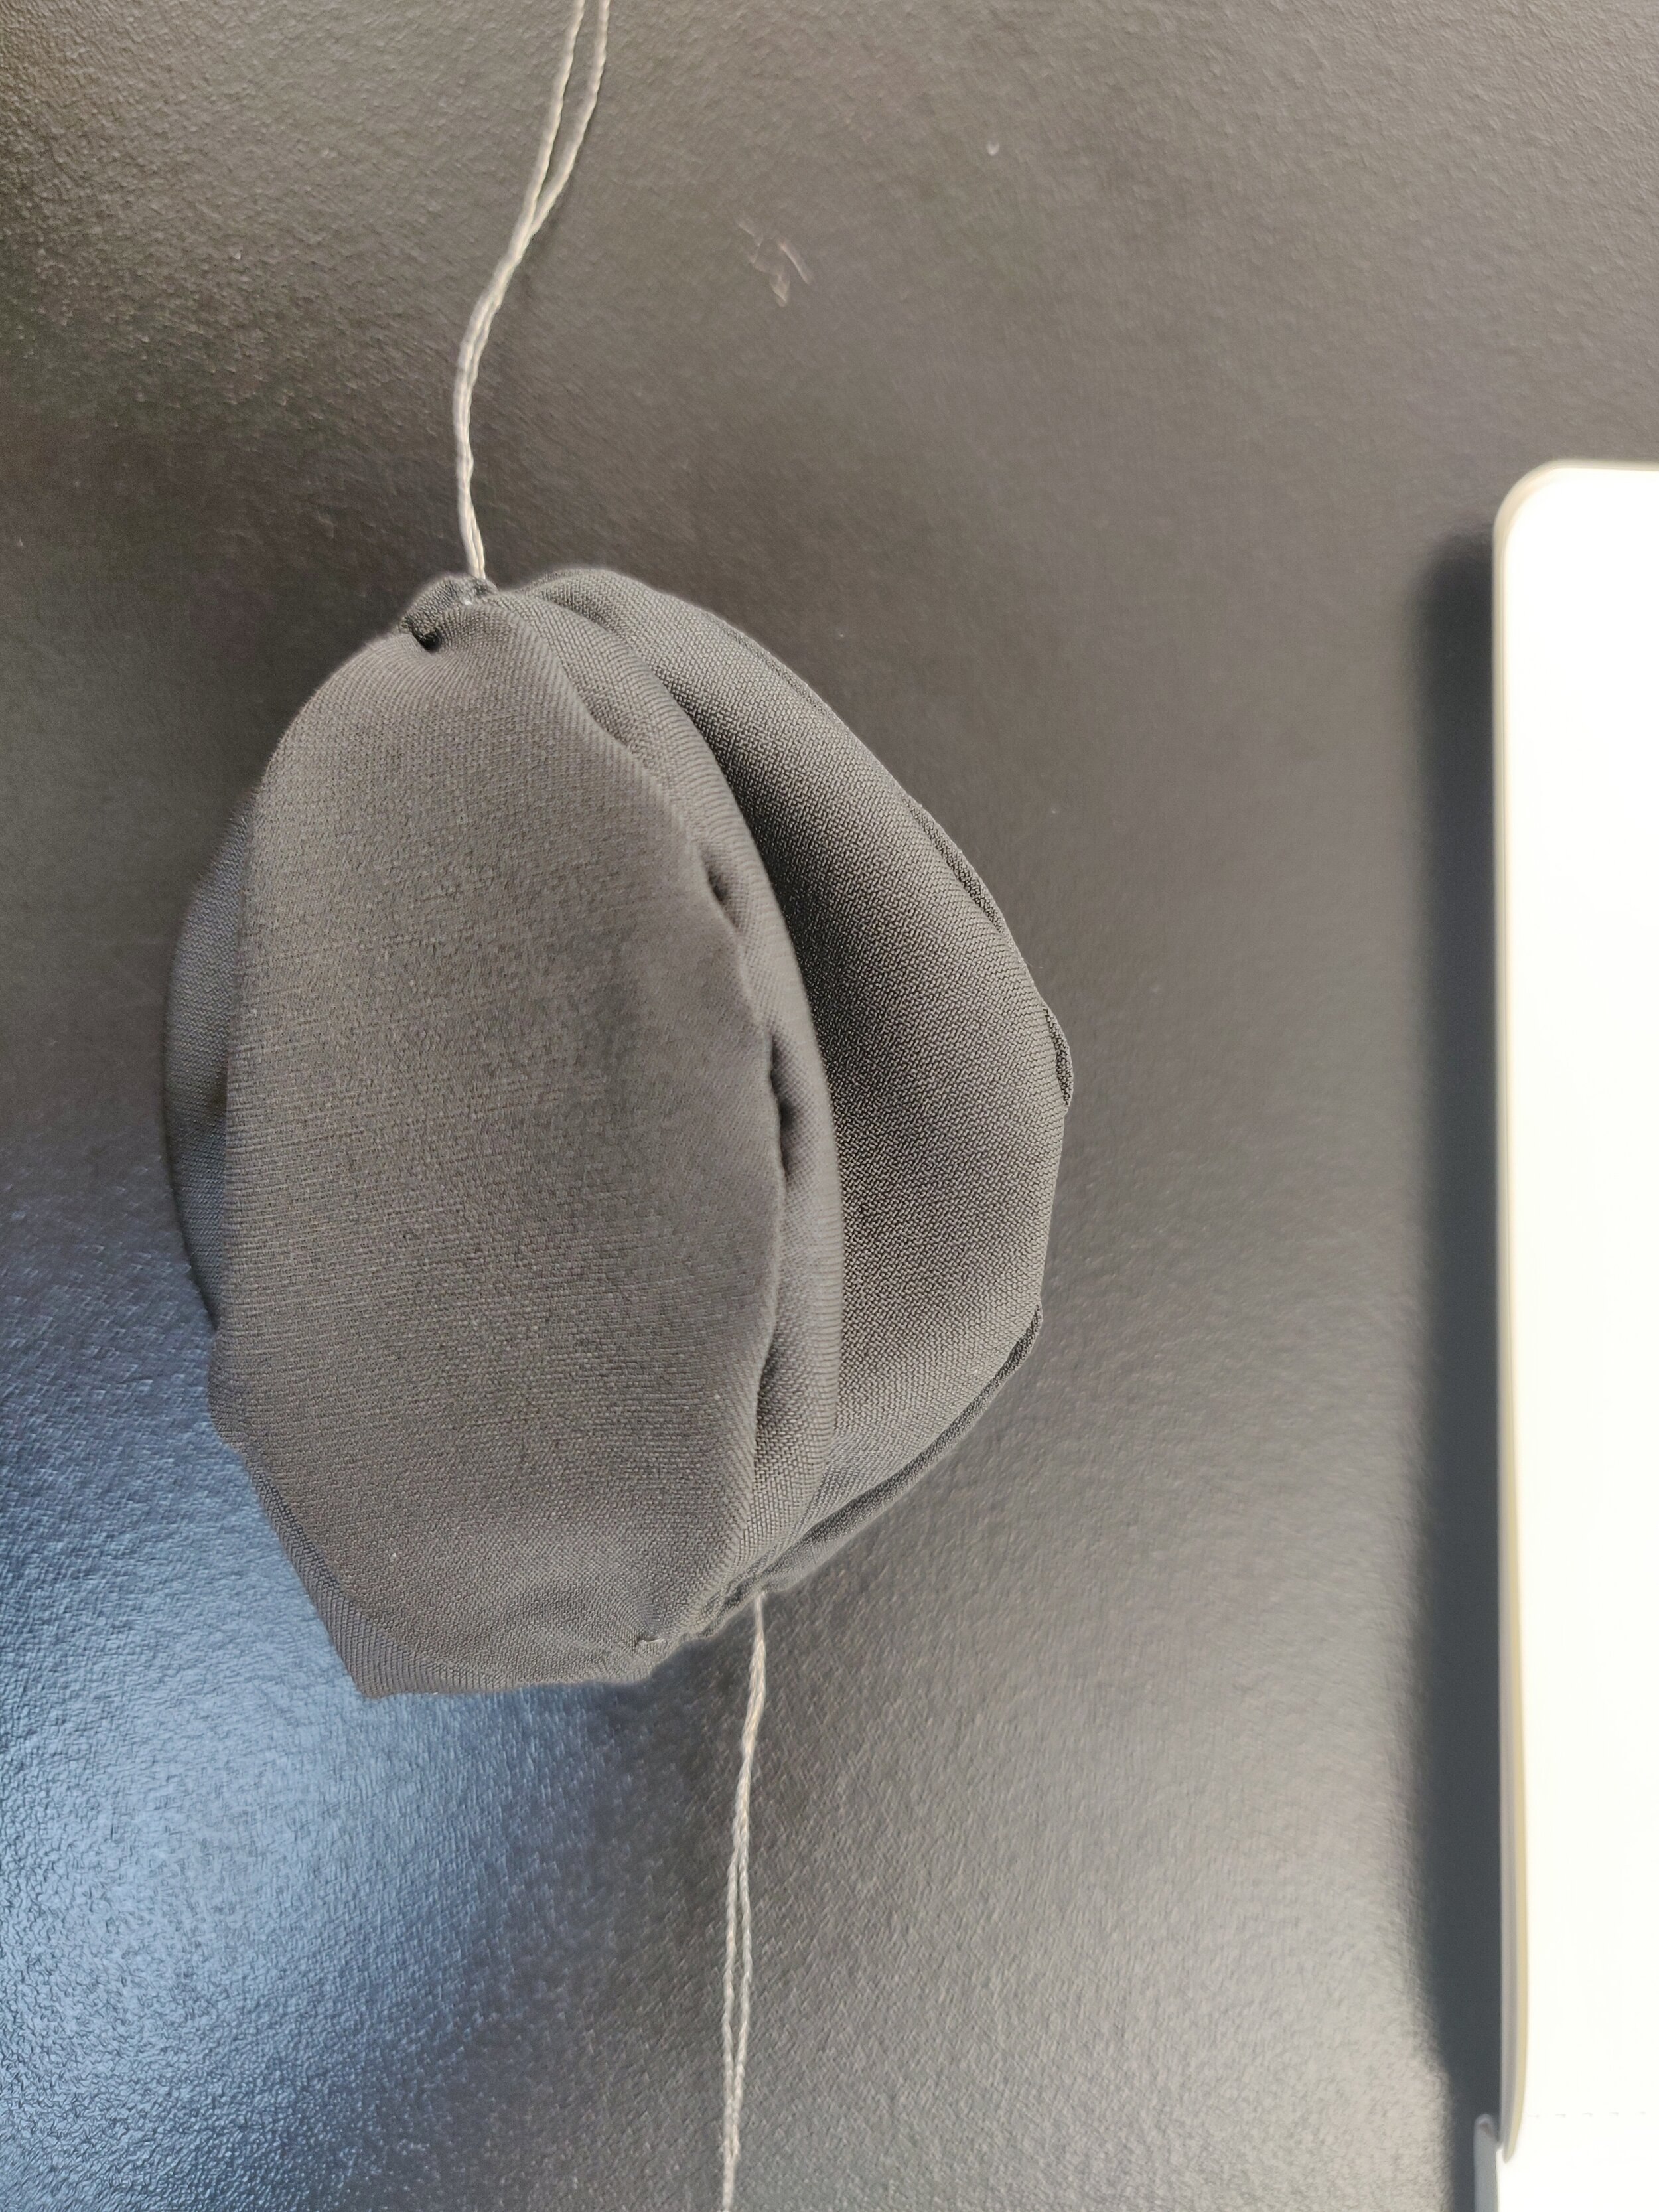
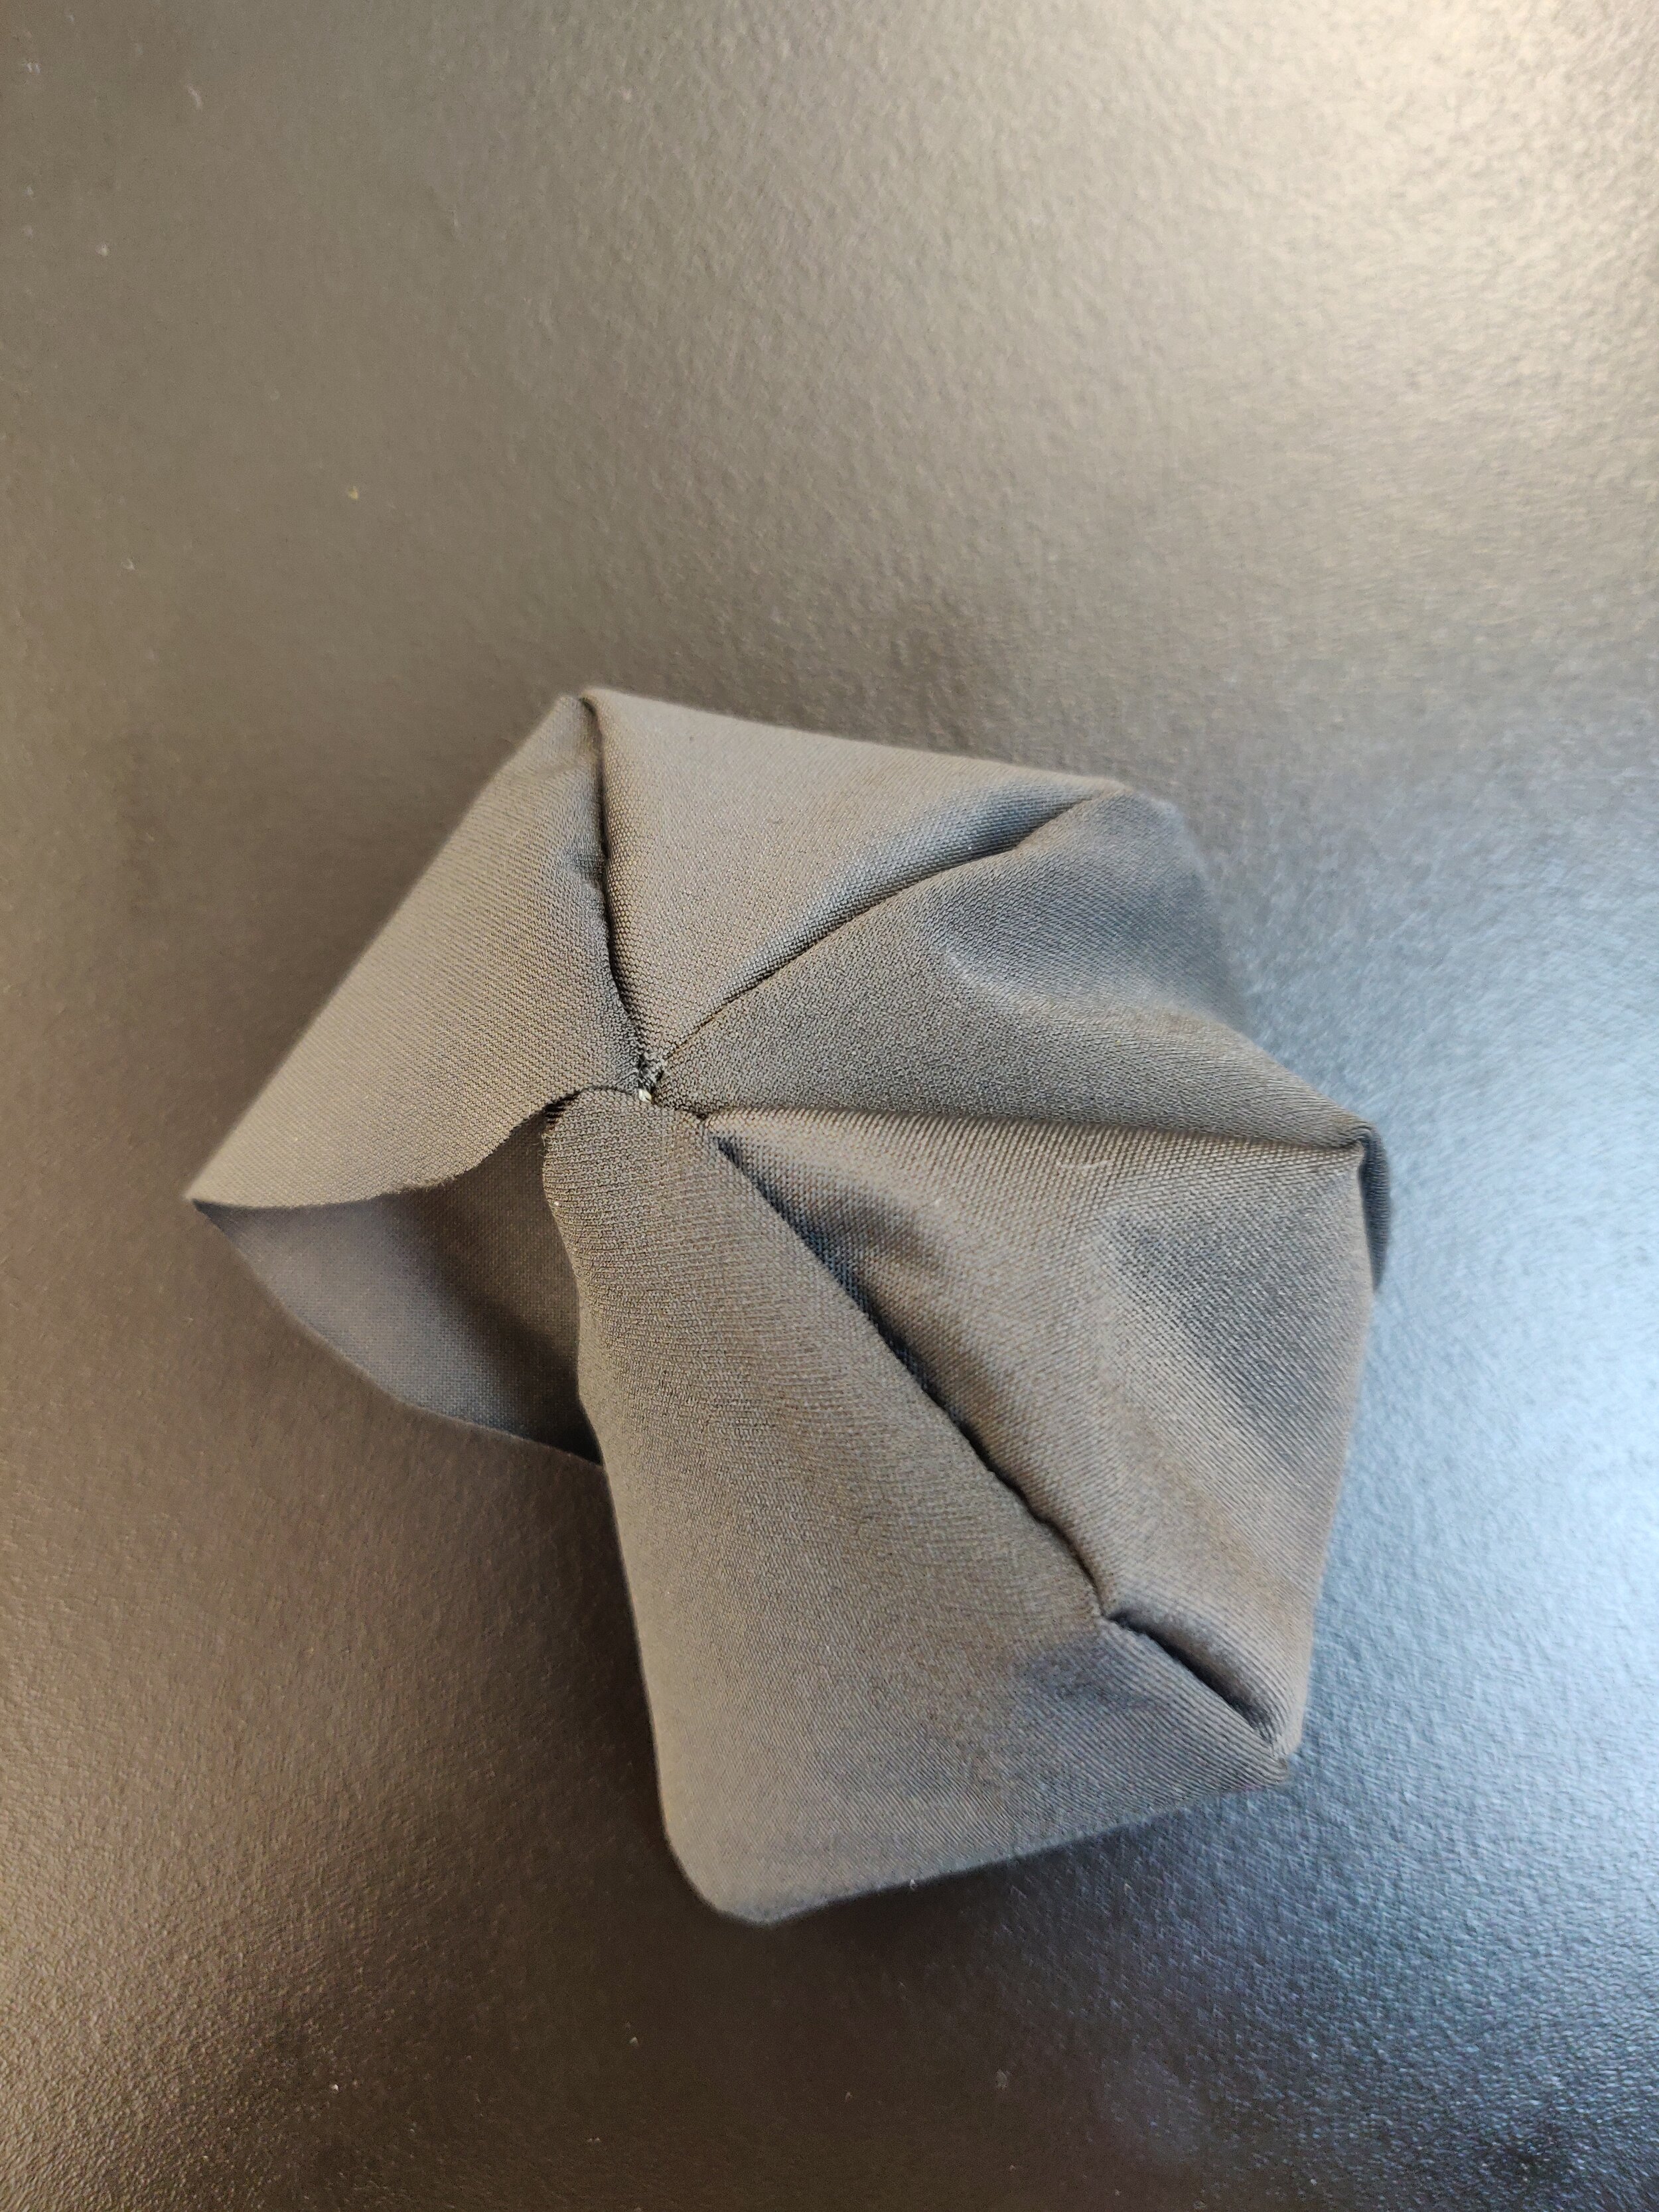
The next step was to produce the same cover but this time with resistive fabric in order to generate the equivalent of a pressure sensor. I had to sew a small circle with conductive fabric in order to be able to collect the values in each side of the sphere and connect it to the alligator wires in order to send the values to Arduino.
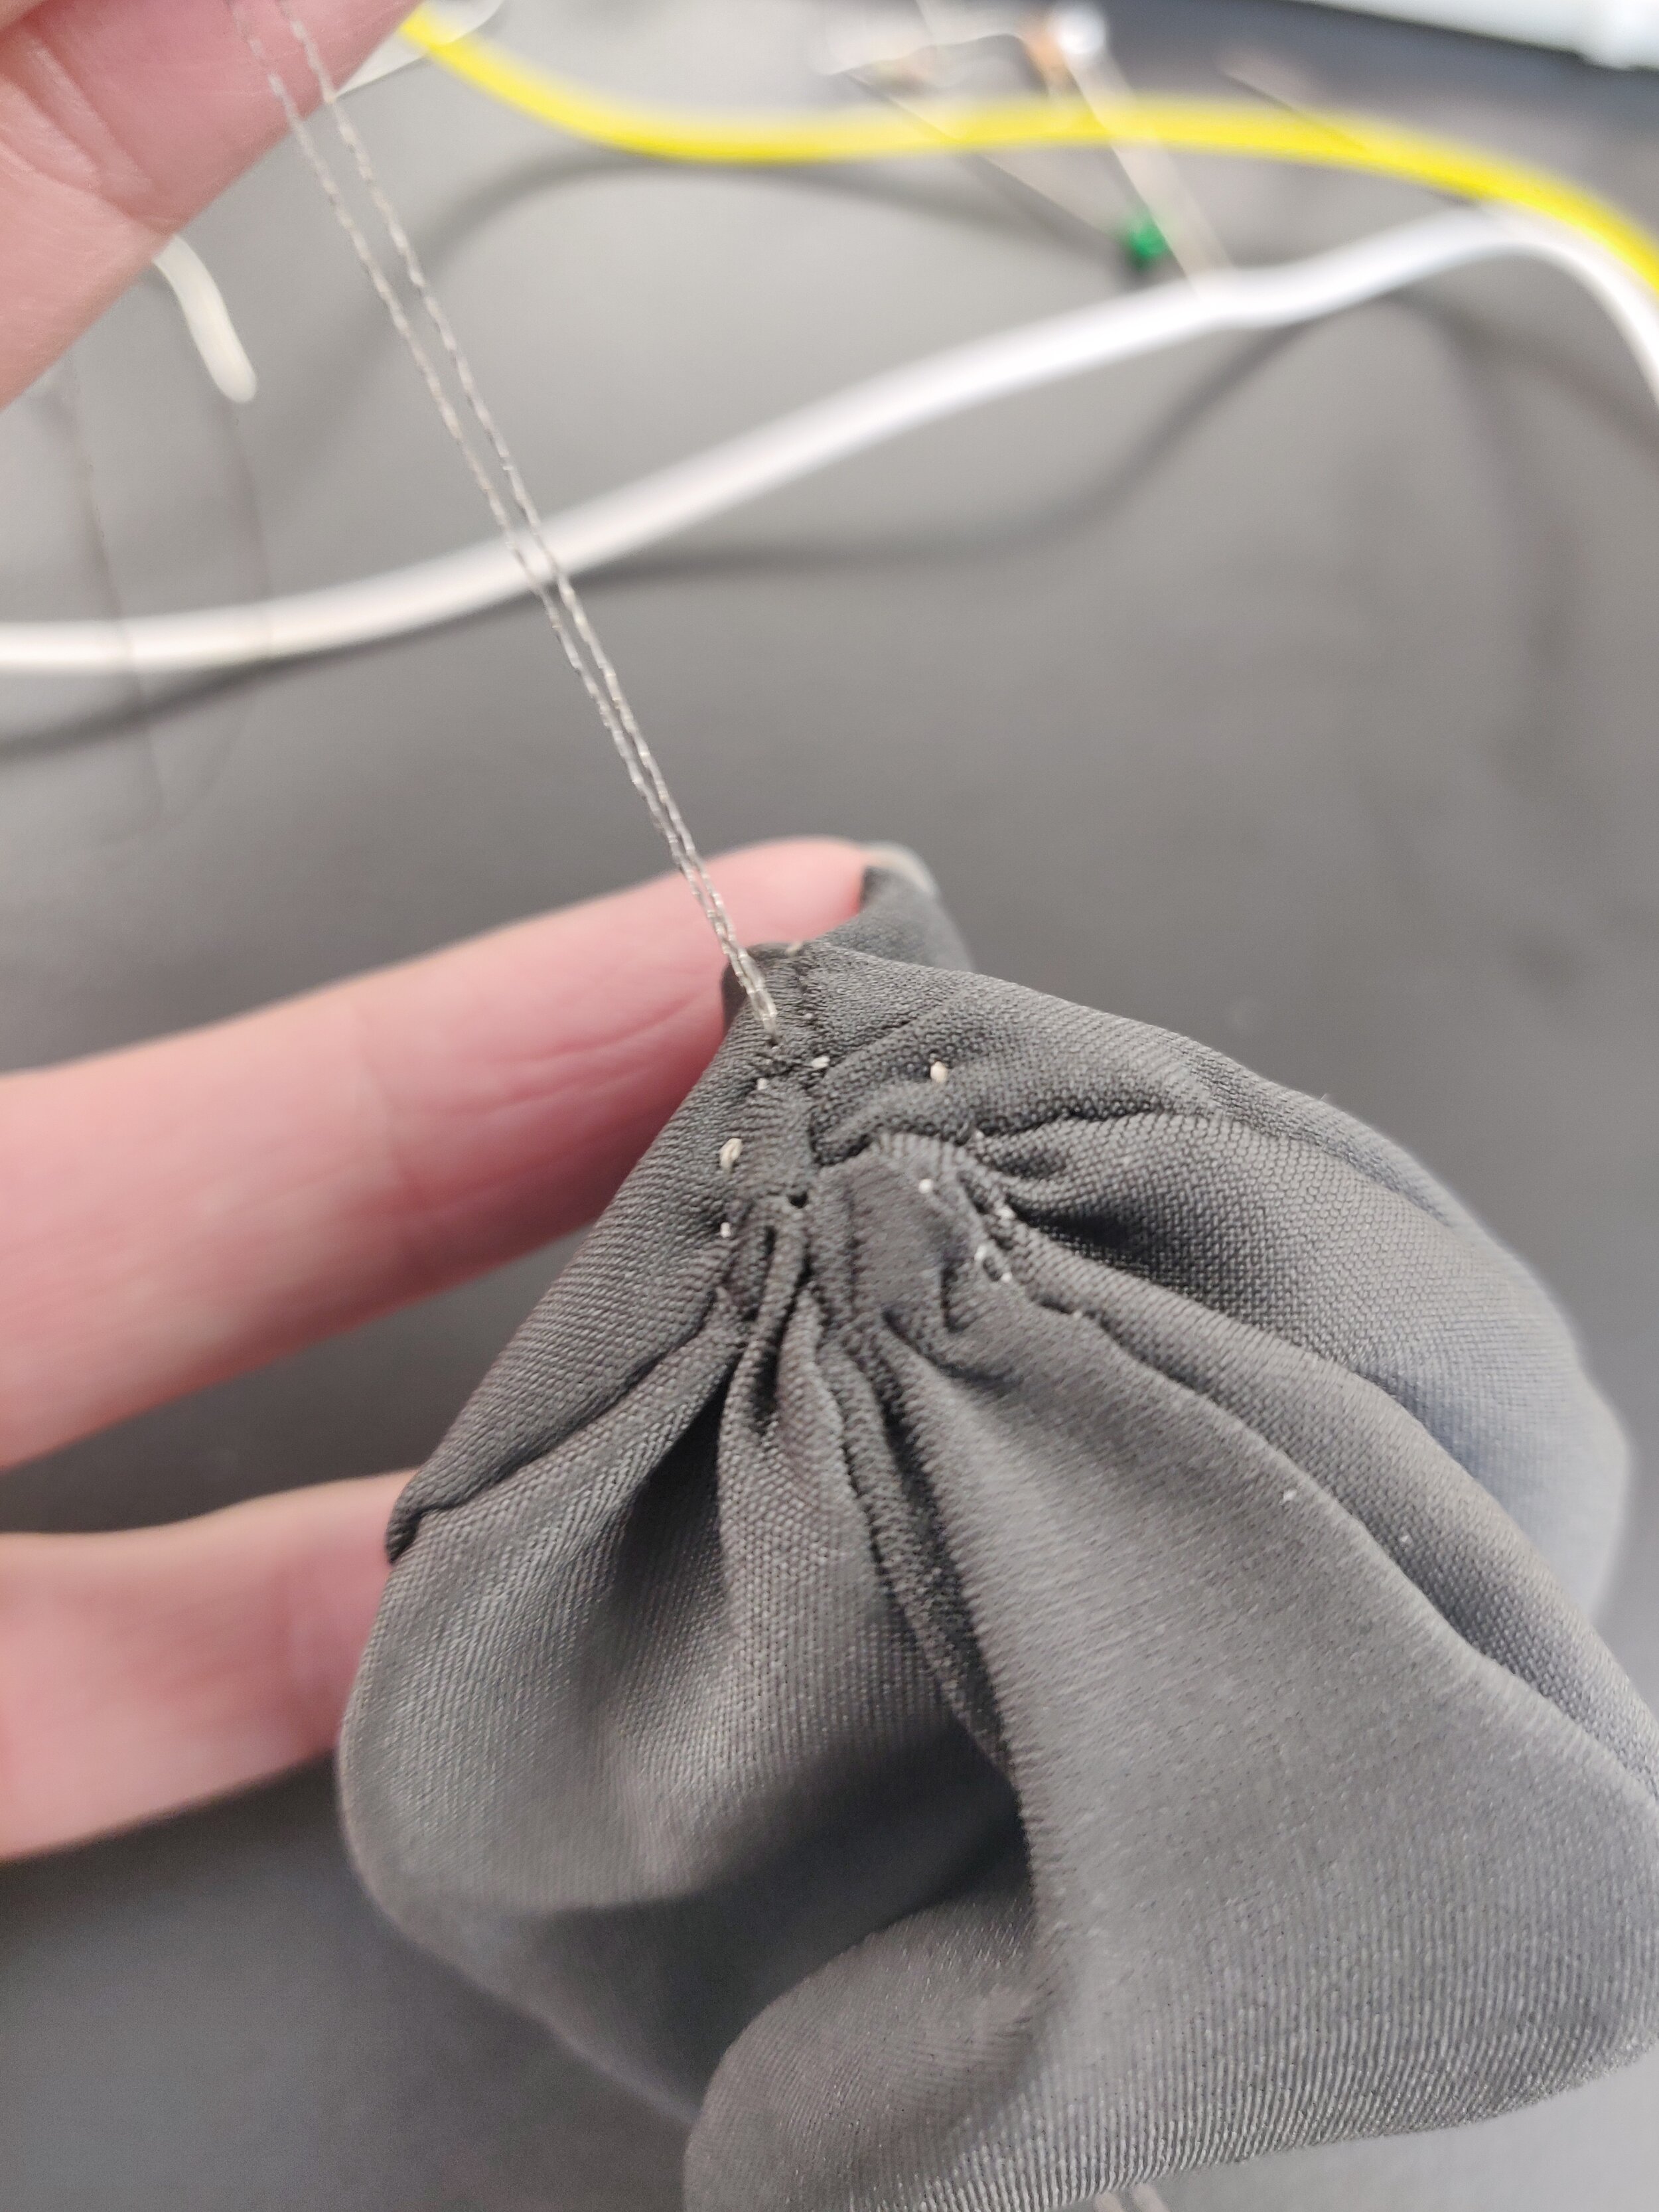
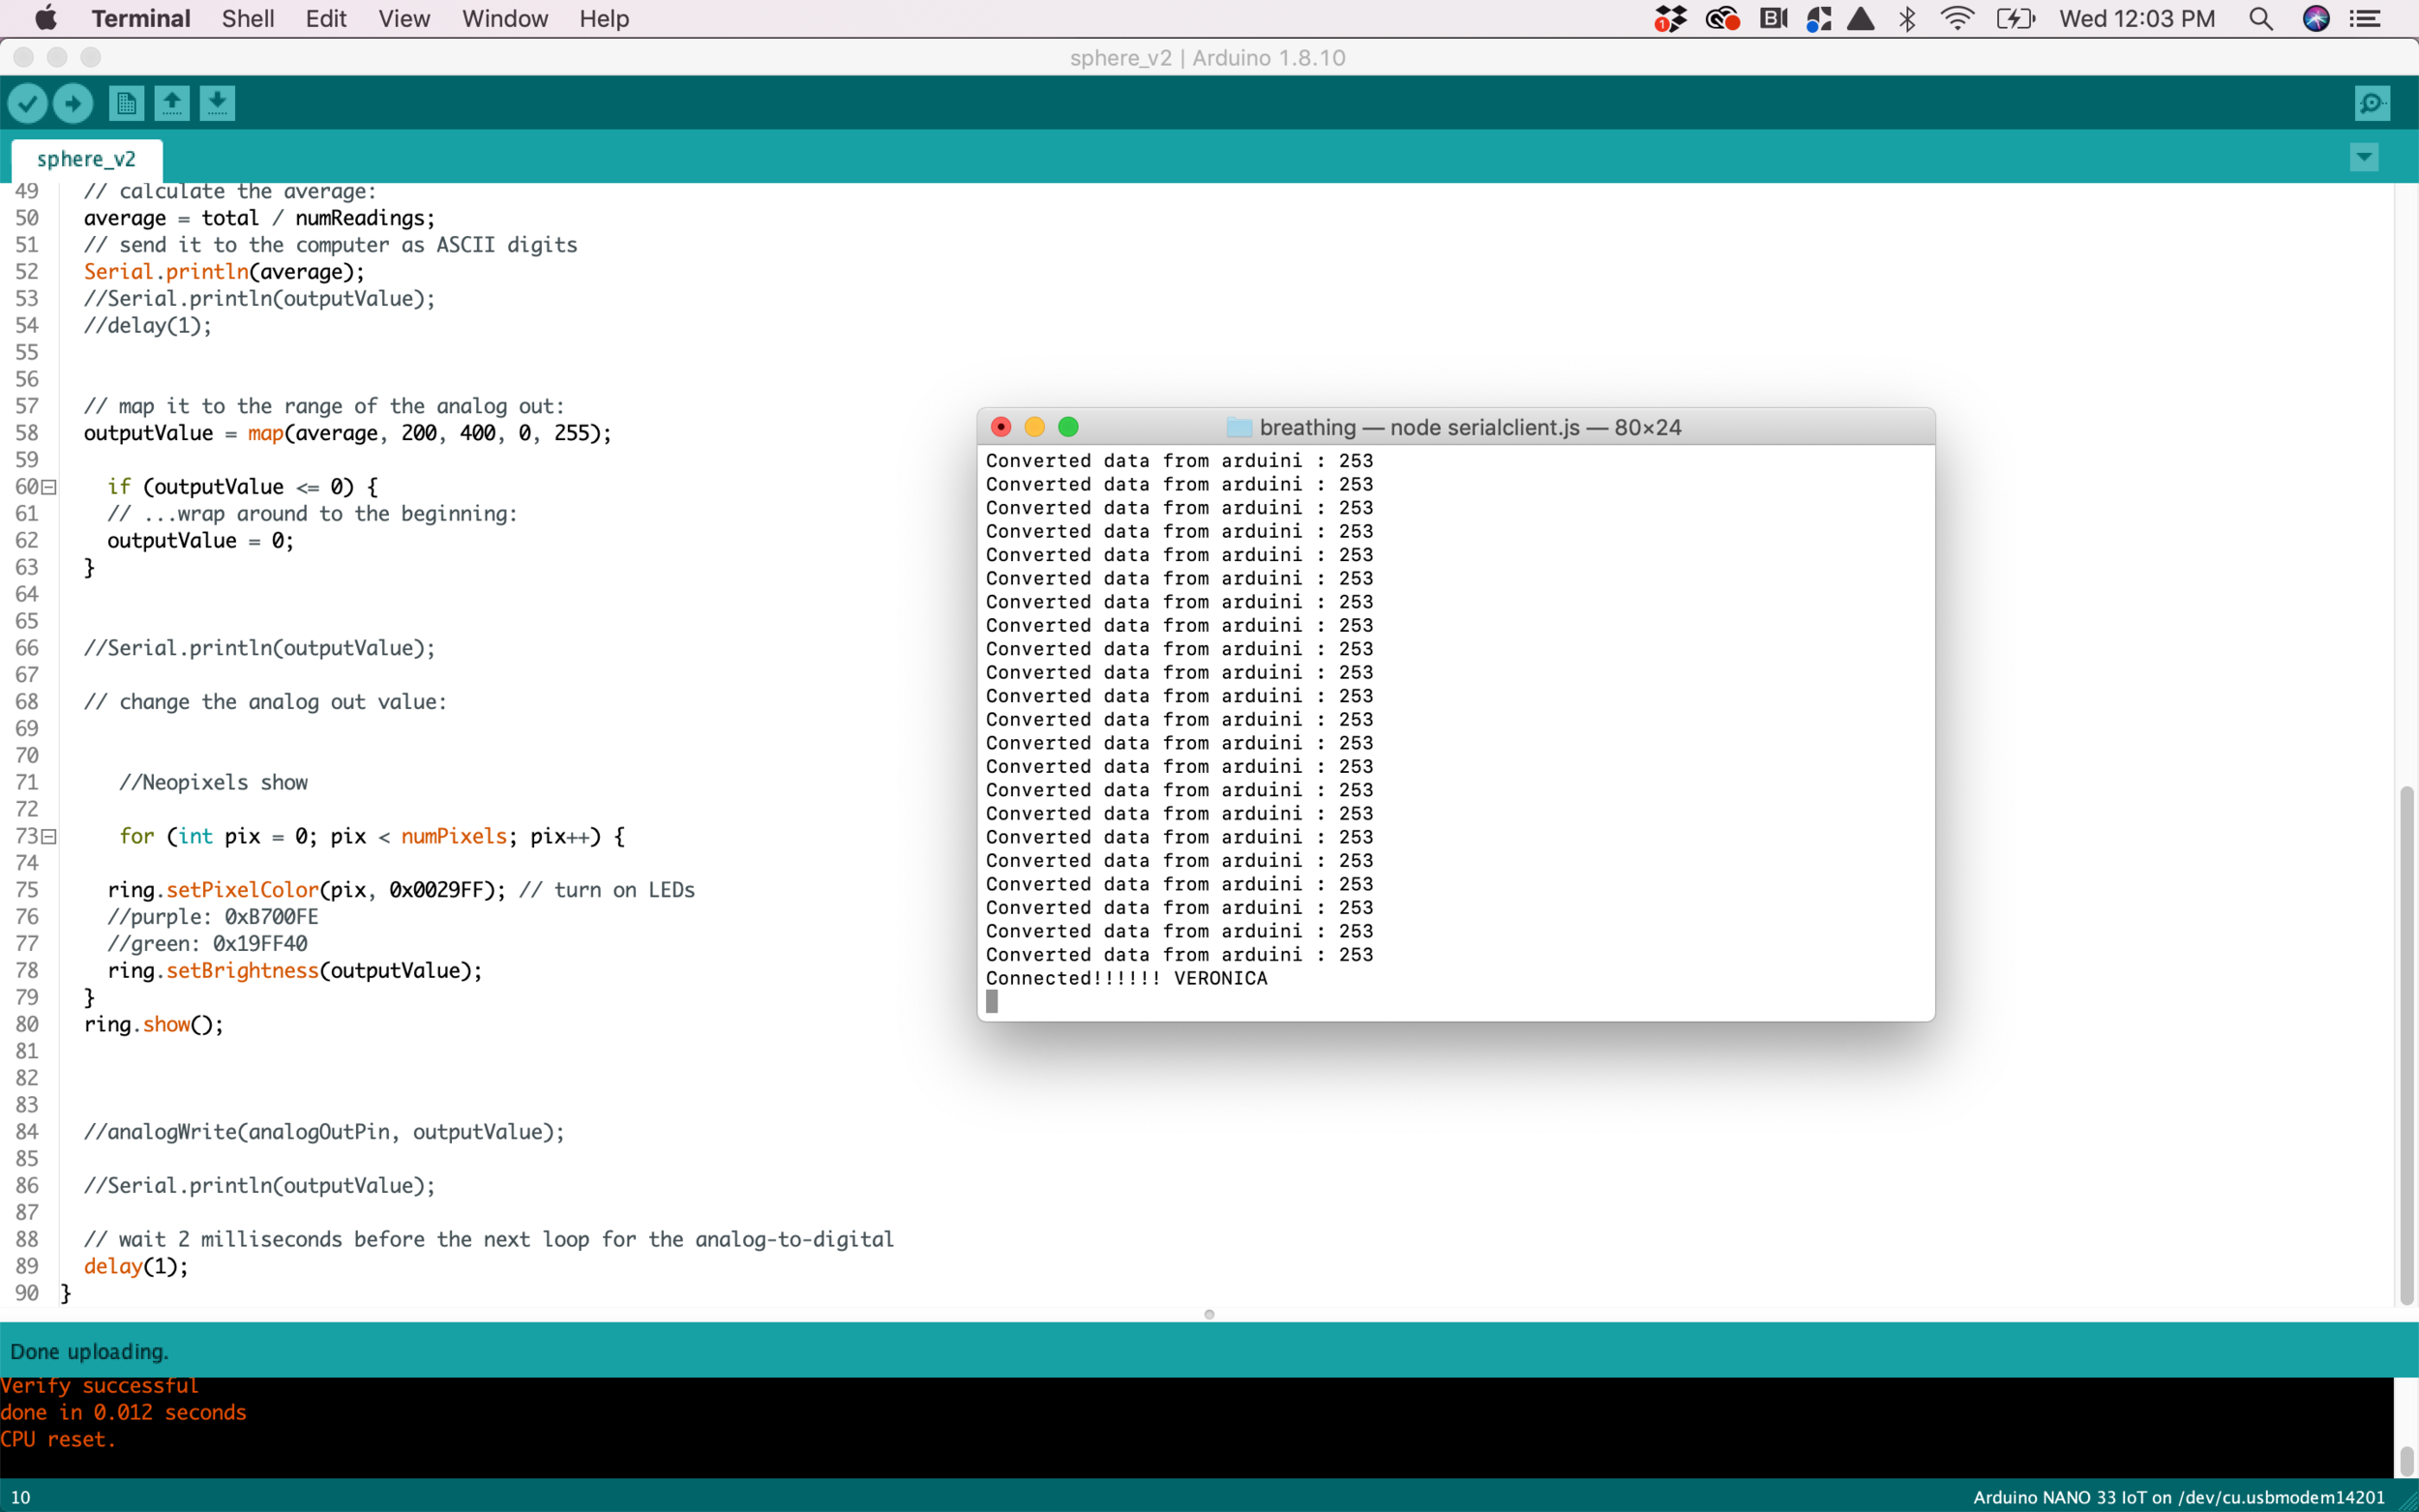
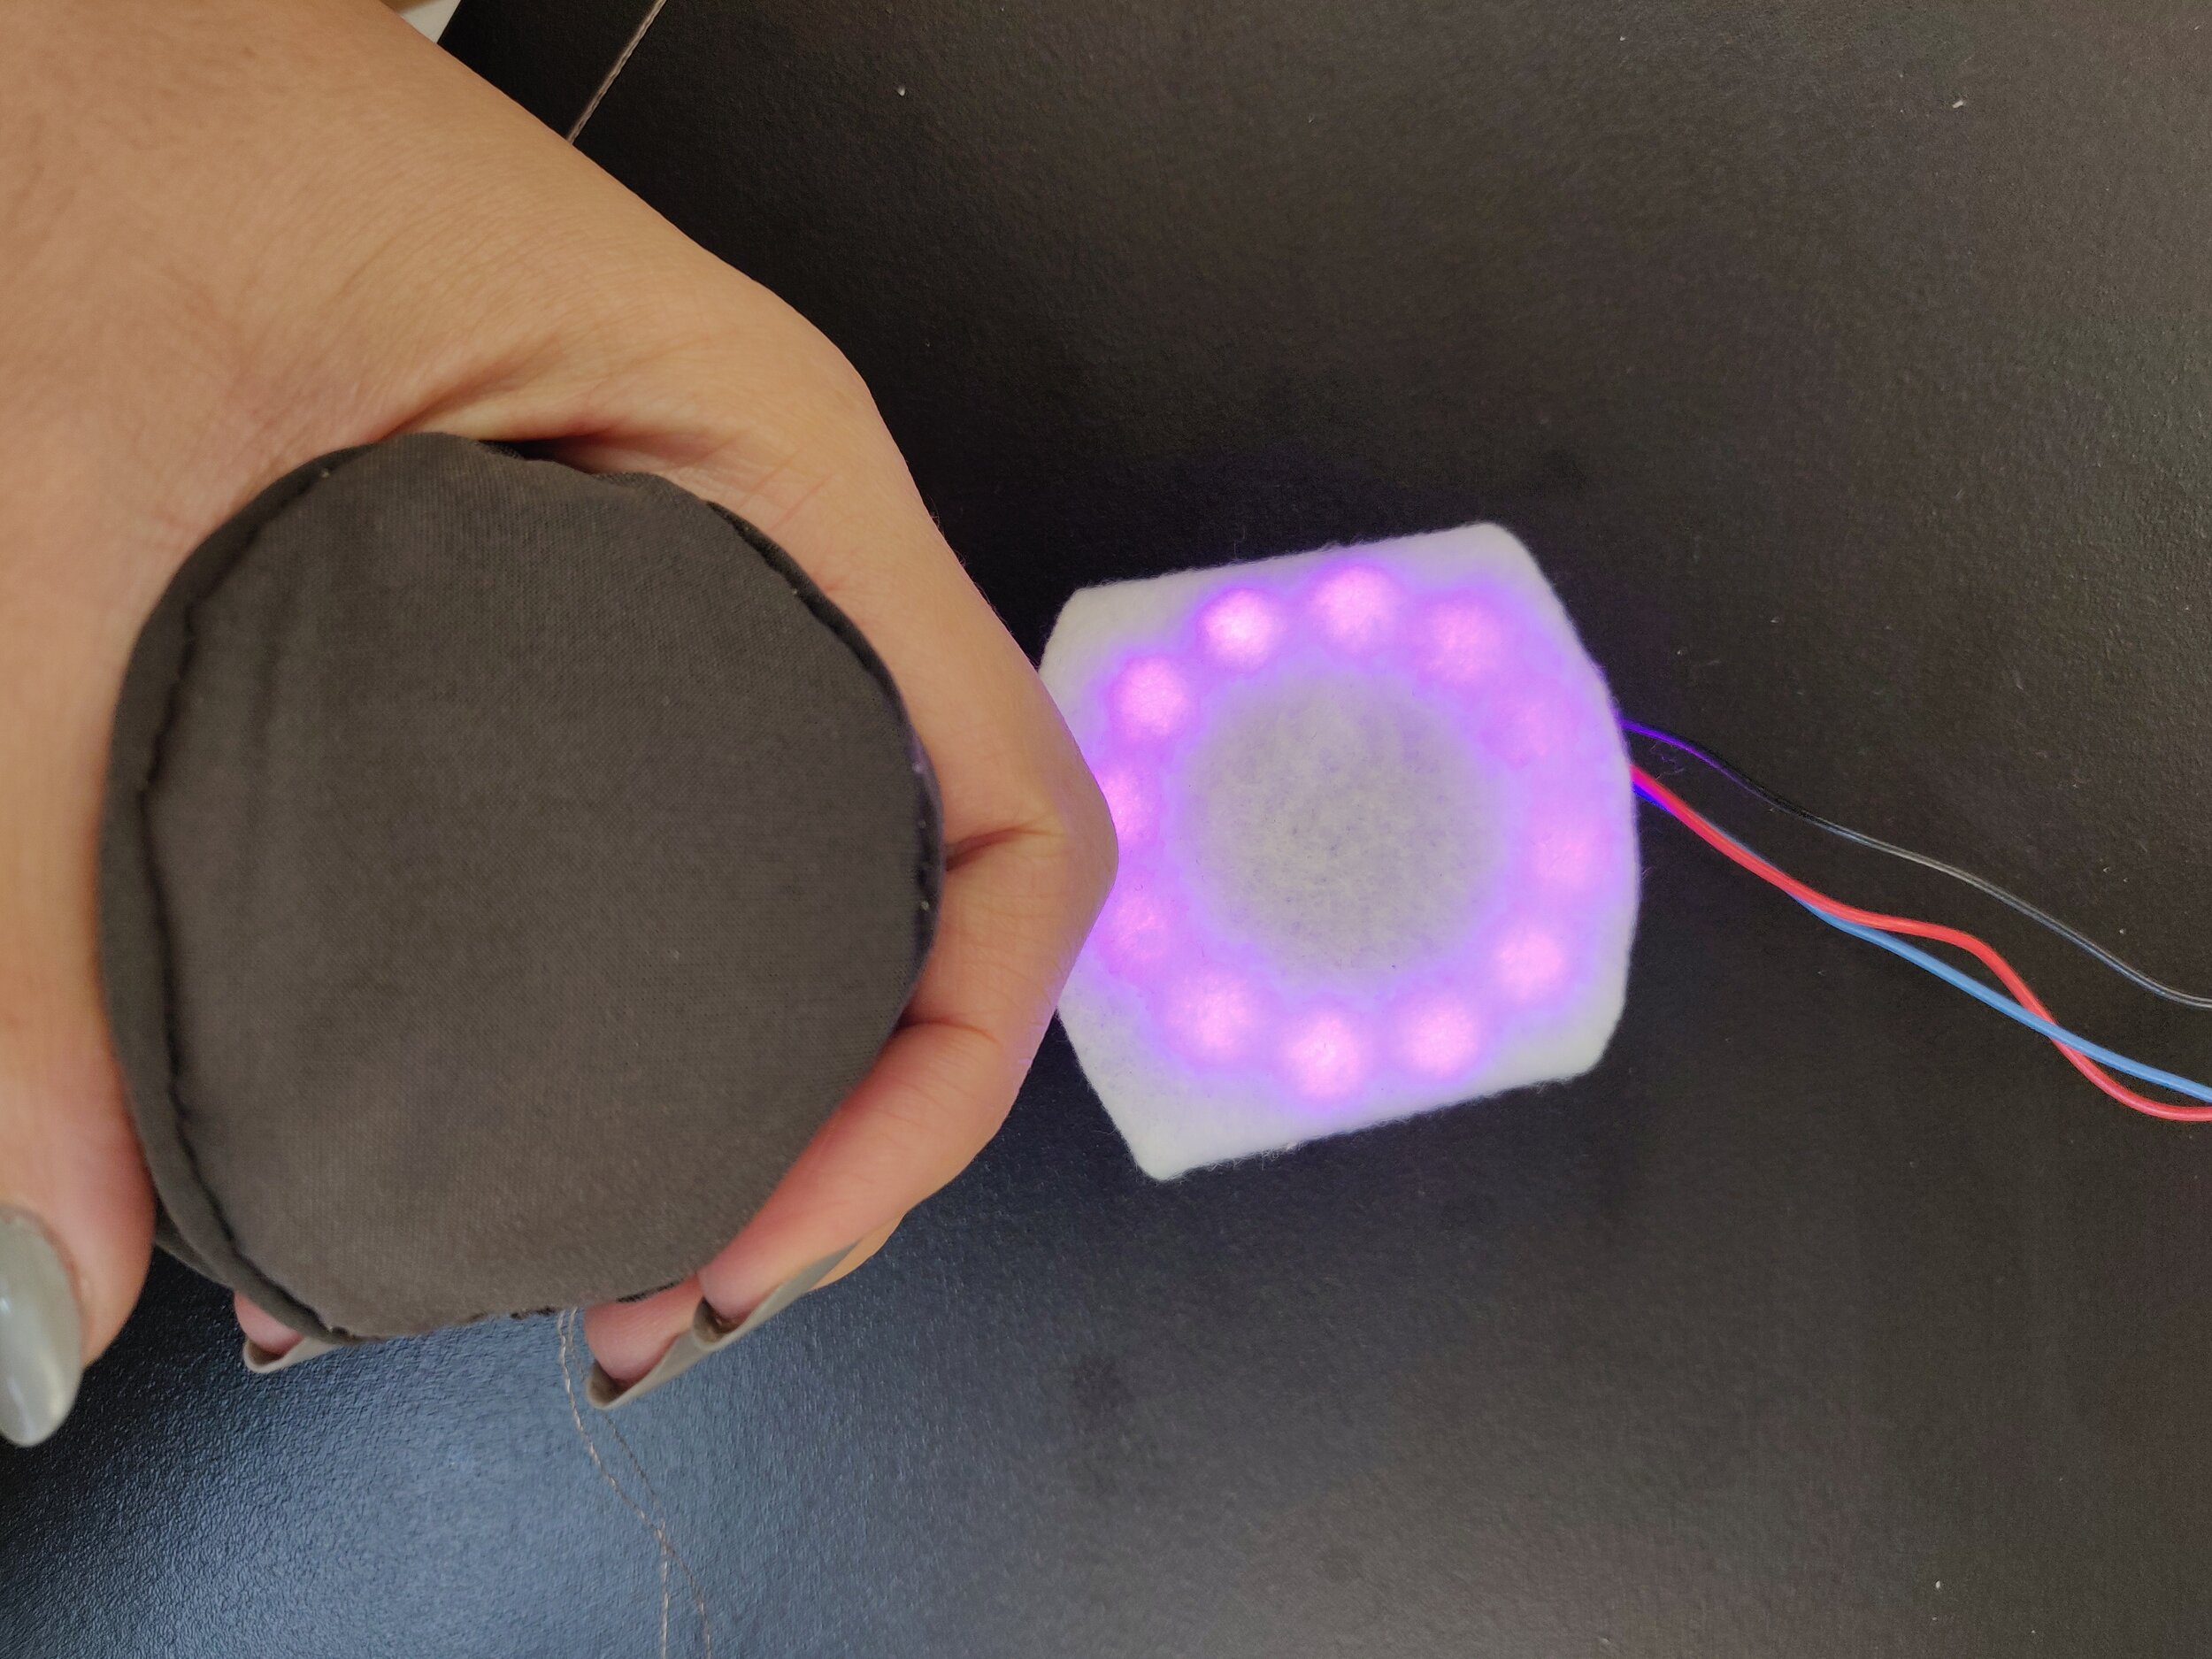
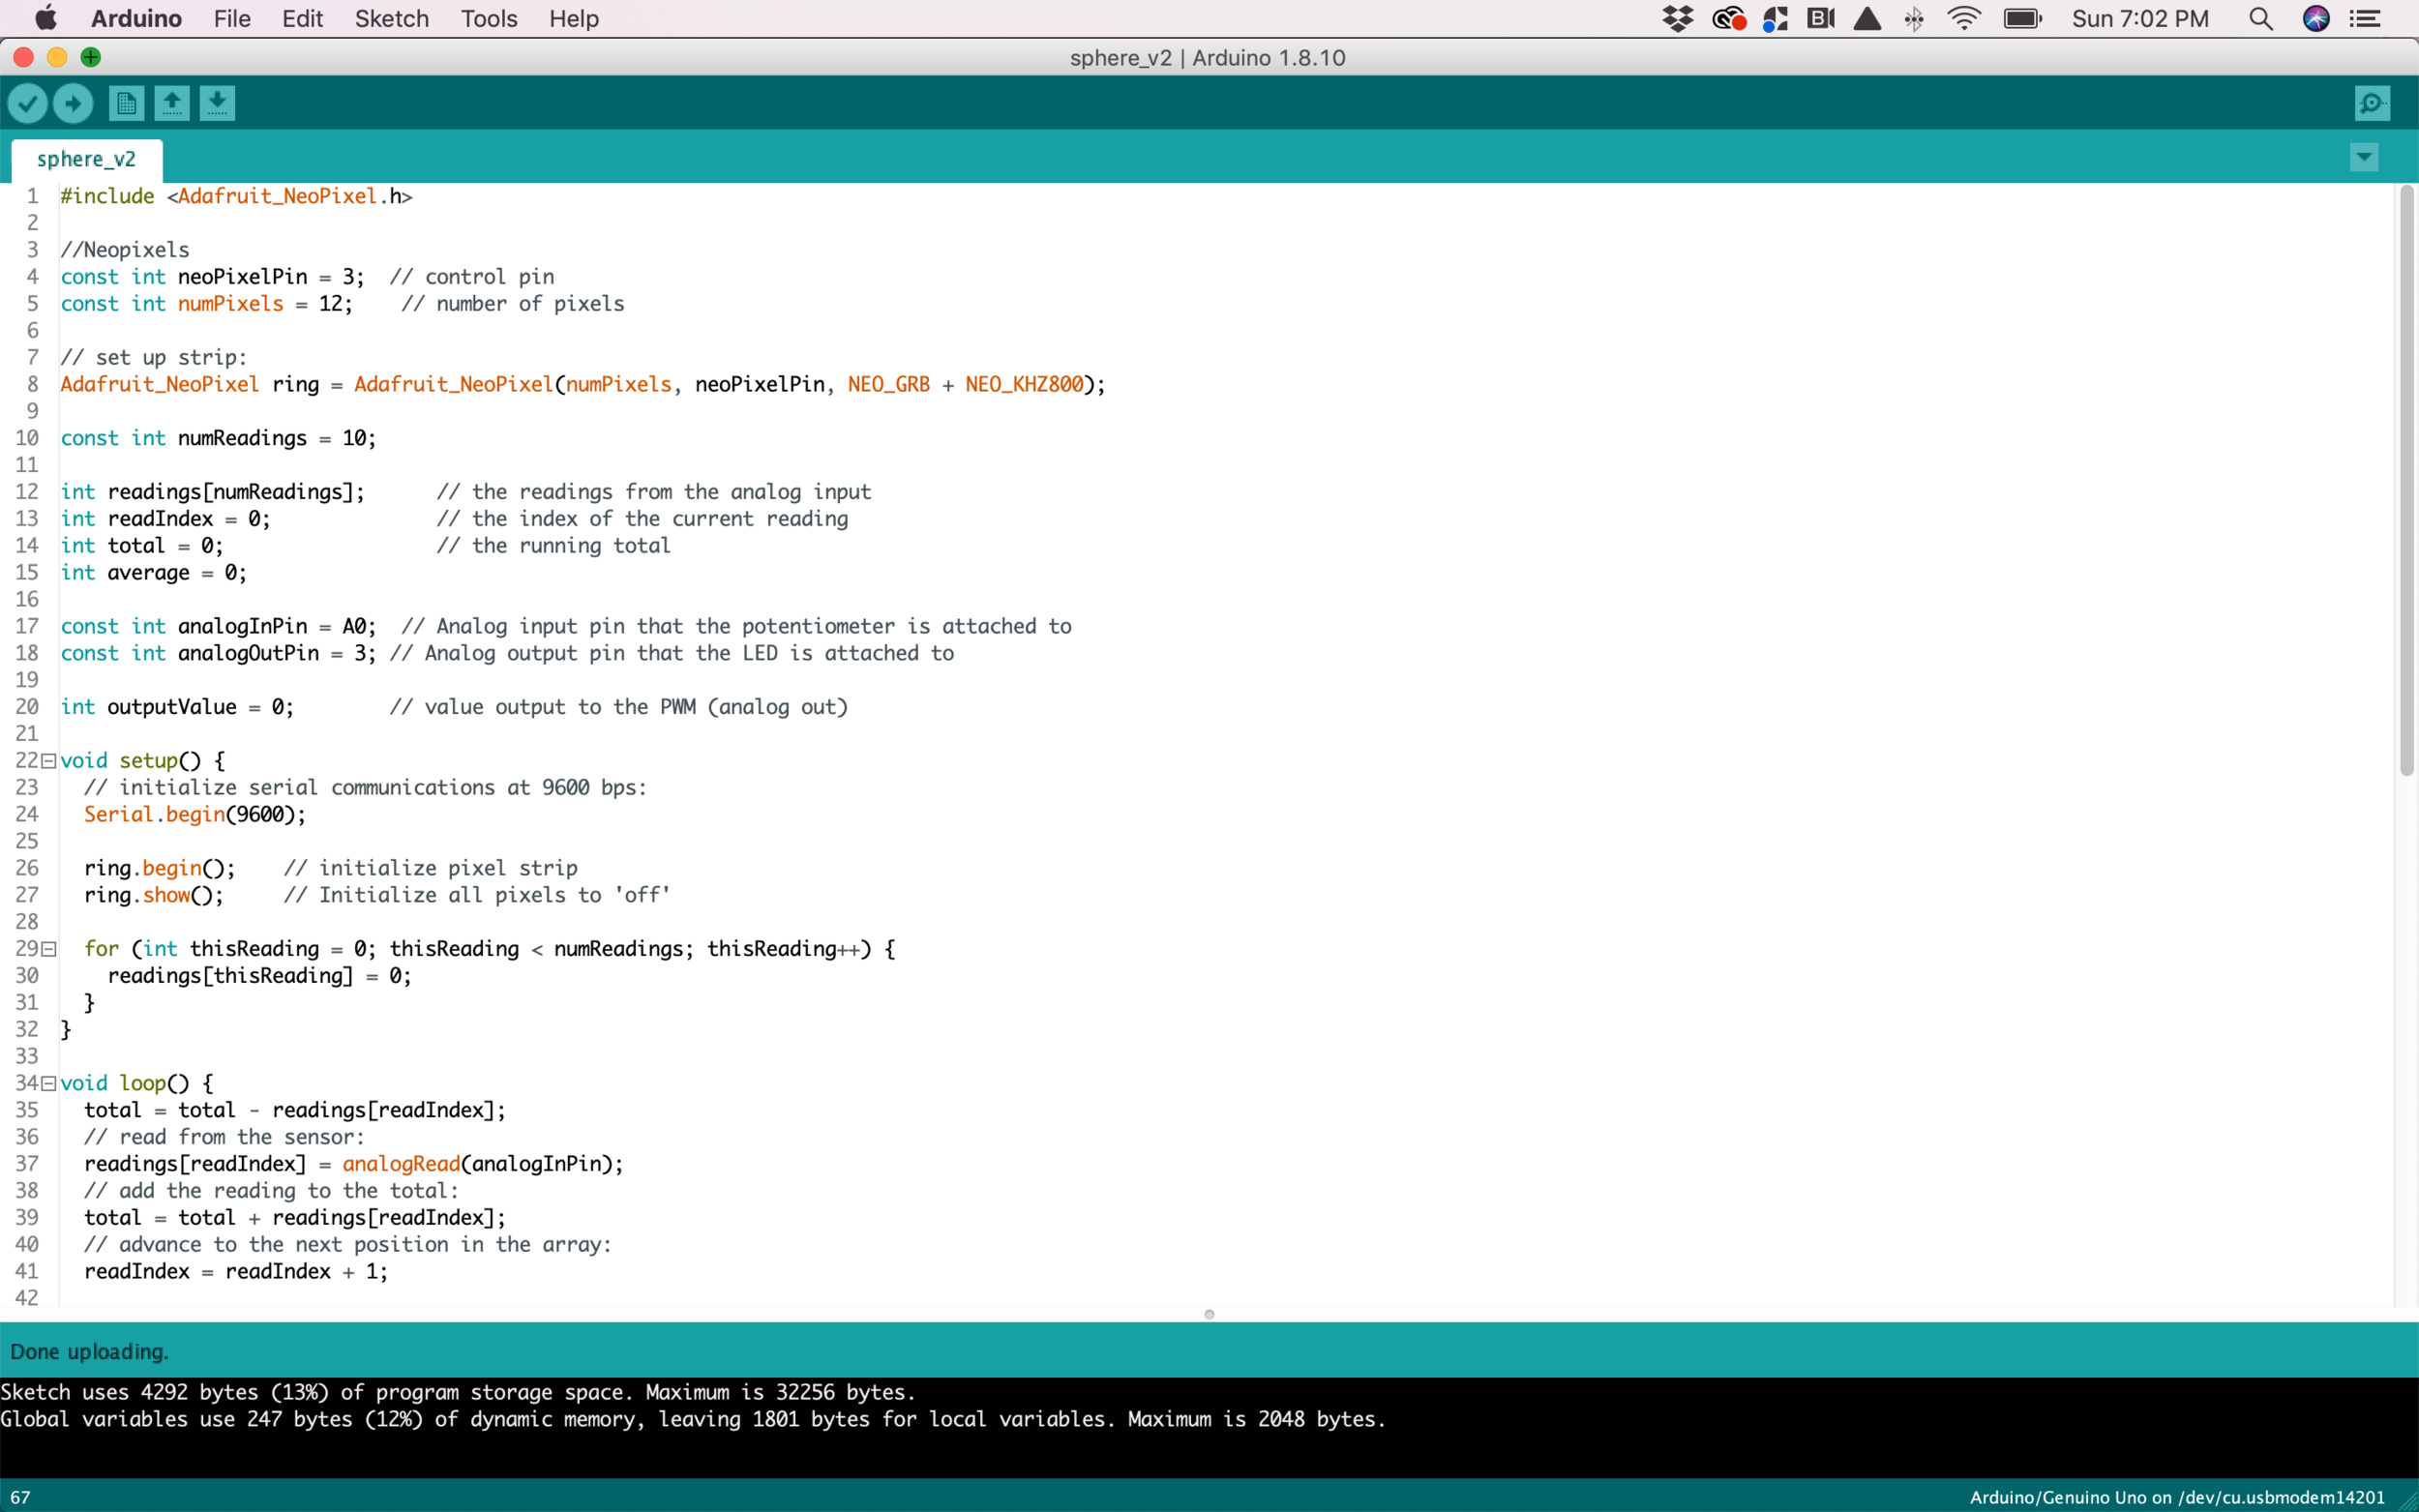
As a final step I added an LED ring in order to use it as my variable interface, and map the values that I was receiving from the resistive fabric and convert those values into brightness. I had to use the smooth functionality in order to have a more stable light and brightness value in the mapping which allowed me to brighten the LED ring when the pressure is higher and decrease the brightness when the pressure is lower.

The final result is a stress ball interface that changes the luminosity of the lights according to the way that the user is squeezing the stress ball.

Lab 2: Creating 3 different buttons

Button 1

For the first button, I decided to create a bridge with a larger material on one side that will close the circuit when the circle was closed. I created a small circle inside with conductive fabric and then ironed it in the inside of a ring that didn’t touch the inside one.

Button 2

For the second button I decided to do a push button with a conductive fabric in both sides and two leather rings in the inside that would require the user to push a little bit harder in order to close the circuit and turn on the light, as a last step I aded a heart to the front part so that it would indicate the exact place to press.

Third Button

For the third and last button I used another material as conductor, I created a headband and used conductive thread to connect it to the alligator clips so that the light would turn on one the headband was closed with the clip.

Manipulating pixels and recording videos

For this section of the class, I decided to focus on being able to run the exercise developed in class and also start thinking on how the functionality to record videos is going to be incorporated in the continuation of my Midterm Assignment and also start preparing for the final.

I want to be able to understand the code more in-depth so I took the opportunity this class to code everything from scratch. The first test was an attempt to complete all the code from class and be able to save images and record videos from the canvas.

First test

First test

Once I was able to do that I started playing with the elements in the screen, the first step was to hide the non manipulated video so that the user could only see the video displayed in the canvas.

Hiding non manipulated video

Hiding non manipulated video

After I was able to successfully save the videos in the local server, I started to incorporate the UI that I have already stablished for my PT and Patient interface in the midterm in order to start visualizing how the PT could save a video for each of the exercises the patient is developing and be able to use them as a source of comparison and motivation for the patient to be able to visually understand the milestones in their recovery.

Implementing UI

Implementing UI

I envision being able to use the stored videos as a way to motivate patients and also a way for PT to keep track of their patient’s recovery.

Being able to save video files.

Being able to save video files.

Lab 1: Creating a circuit

For the first lab we were asked to create a circuit using conductive thread, felt, a battery and an LED. I started by creating a drawing with a pen in order to mark the path for the thread to be, I used a simple stitch in order to make the path and reach the far end of the felt.

I decided to keep the battery holder in order for the lab to be easier to complete and I used a blue LED with the twisted legs so that I could sew it to the corner of the felt. Once the positive side of the battery was connected to the long leg of the LED and the negative side of the battery was connected to the short leg of the LED I was able to close the circuit and light up the LED.

Building a textile circuit

Building a textile circuit

Thesis Class 1

During my time at ITP I have had a clear goal, improve people’s lives by using technology and design. I have tried to choose classes that would enable my learning in three main areas:

  1. Improving Healthcare with design and technology.

  2. Assistive technologies for people with disabilities.

  3. Data Visualization to improve scientific research

Thesis proposal

I would like to find a way to correlate these three buckets and taking into consideration my interest for Tech for Social Good and Critical Design as a base to guide my process and my research.

Proteomic Data Visualization

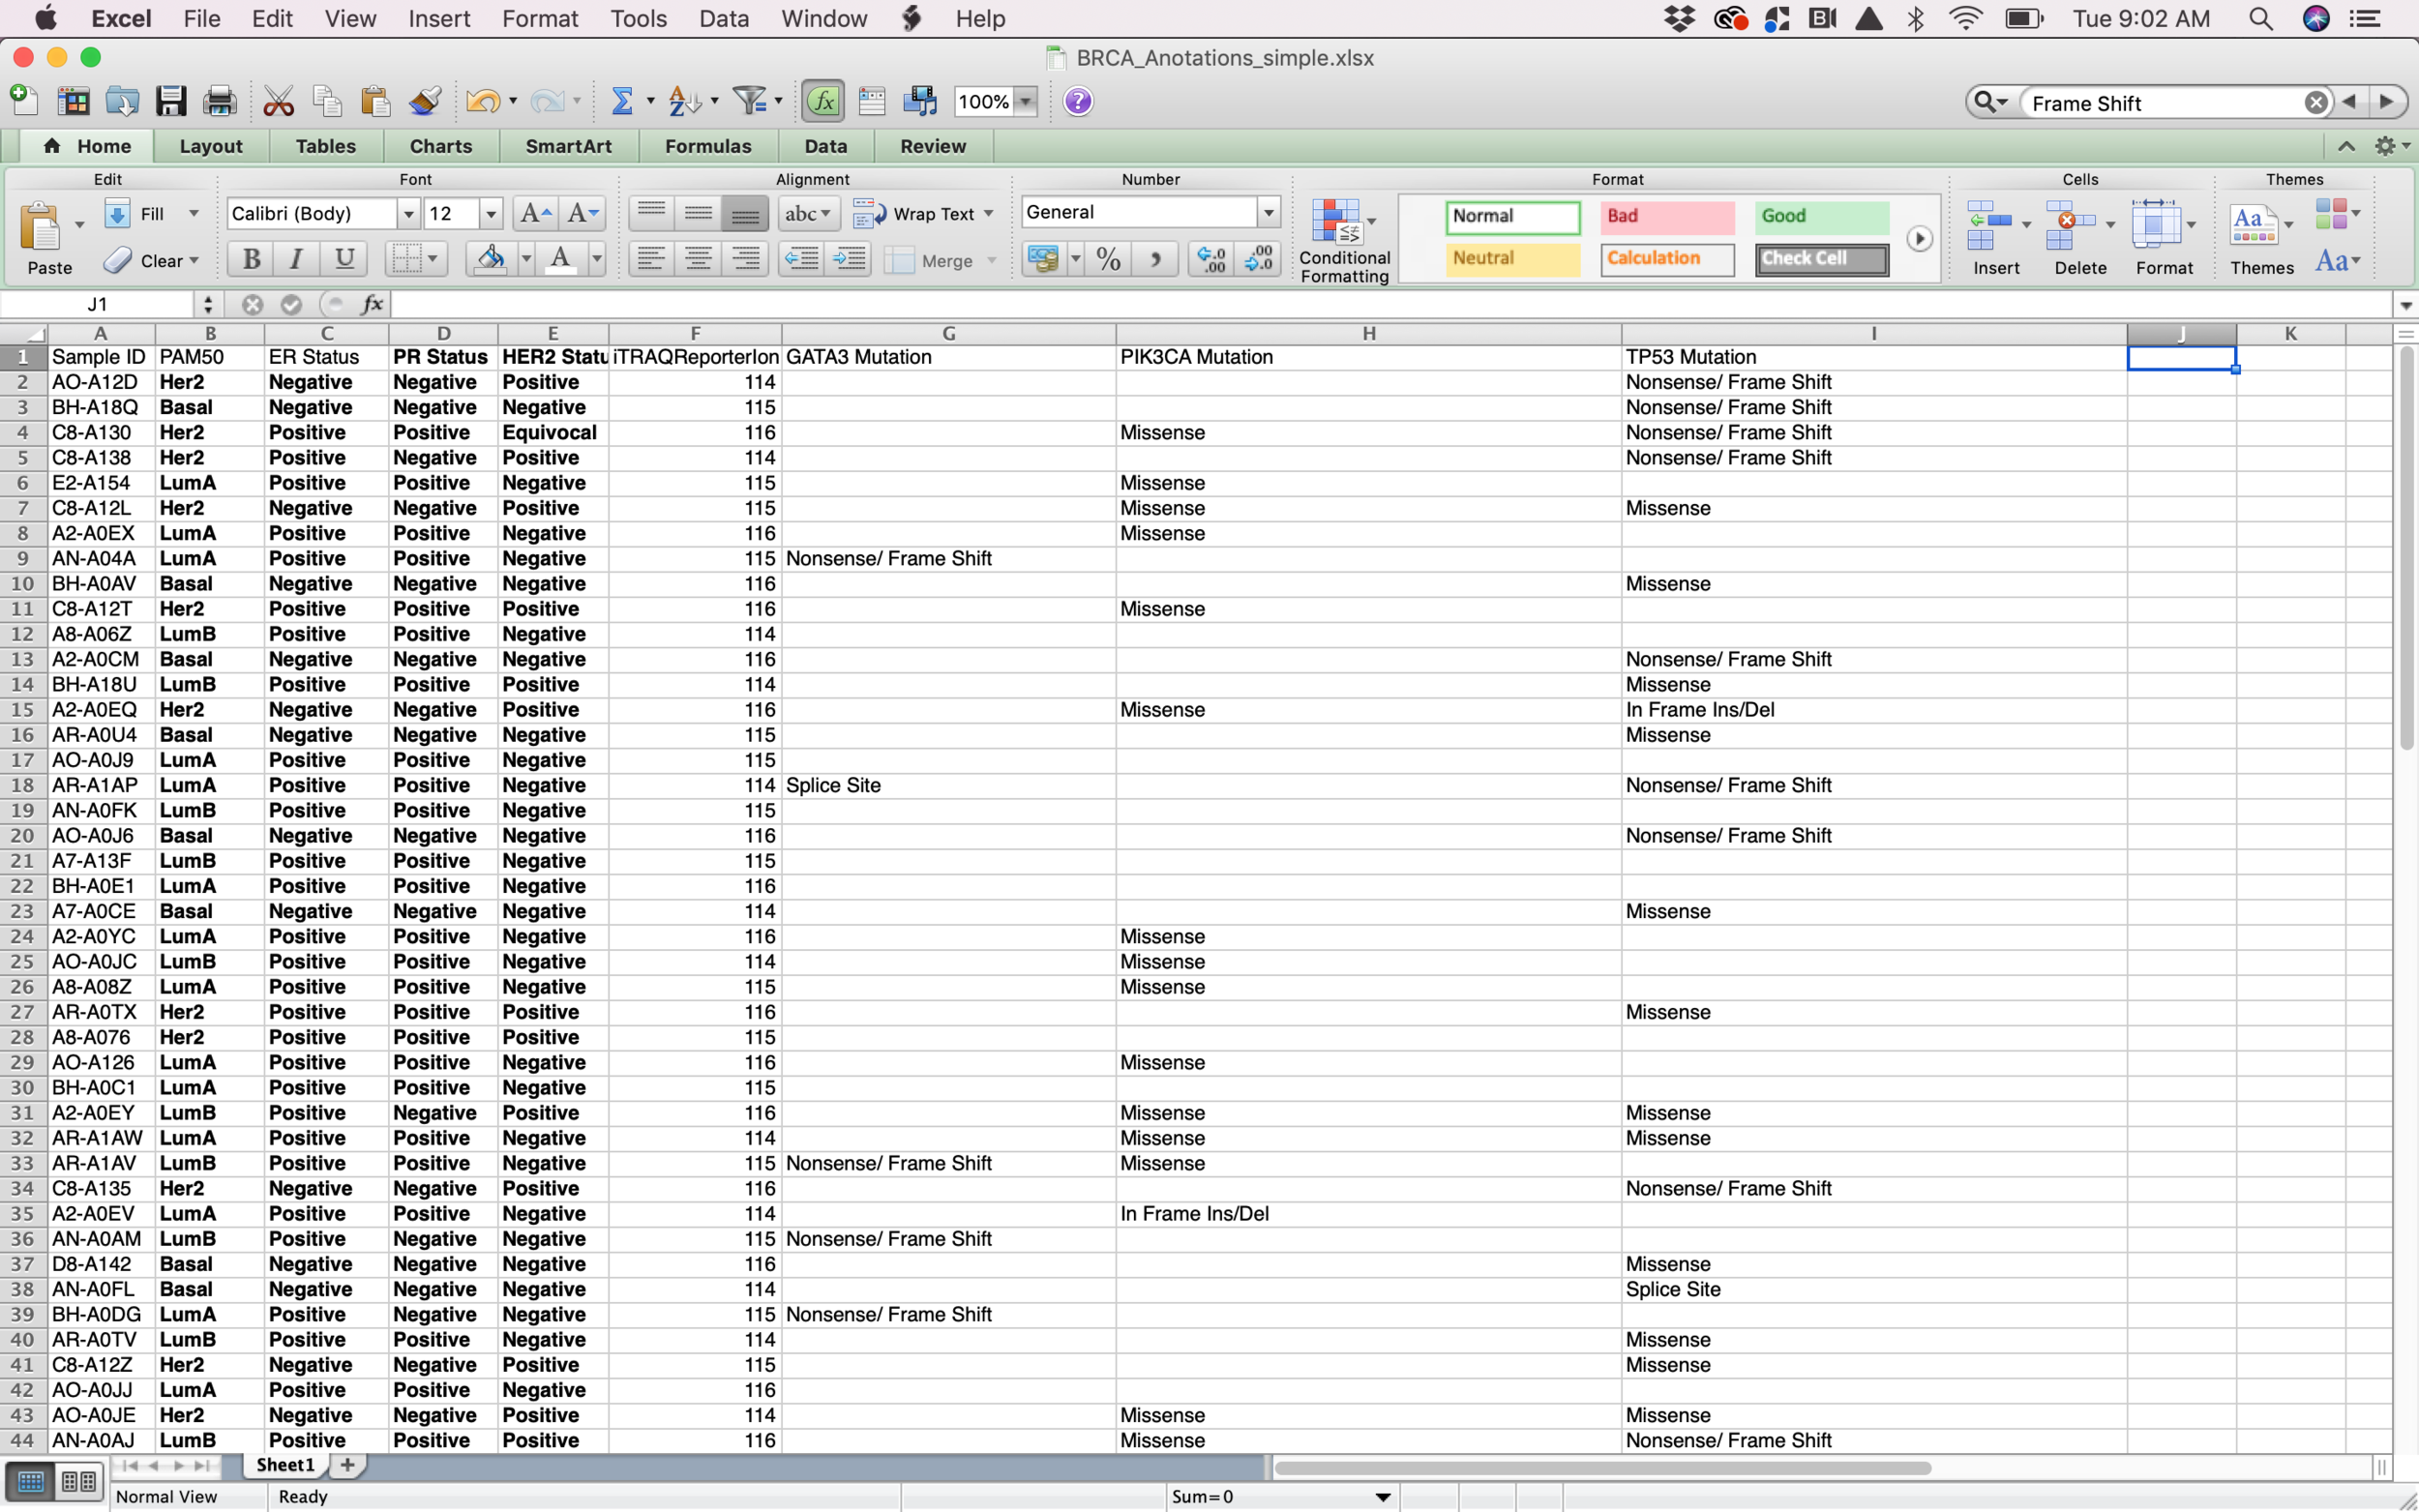
For my archive assignment I decided to work with biological data. Tis is one of the reasons why I decided to take the Data Art class therefore I wanted to use this opportunity to navigate the process of collecting the data from a real organization, understanding complex data and defining a design process in order to be able to provide value out of the archived data.

I was able to collect the data from Ruggles Lab part of NYU Langone, at the beginning of my Summer internship I has the opportunity to talk to Kelly Ruggles after my colleague hard that I was particularly interested in biological data. Kelly mentioned that if I ever needed some data to play around with, to get in contact with her, therefore I thought this assignment was the perfect opportunity to get involved with some previously collected data. I also had some visual reference to one of the papers published by the Lab in which they were visualizing a similar set of data.

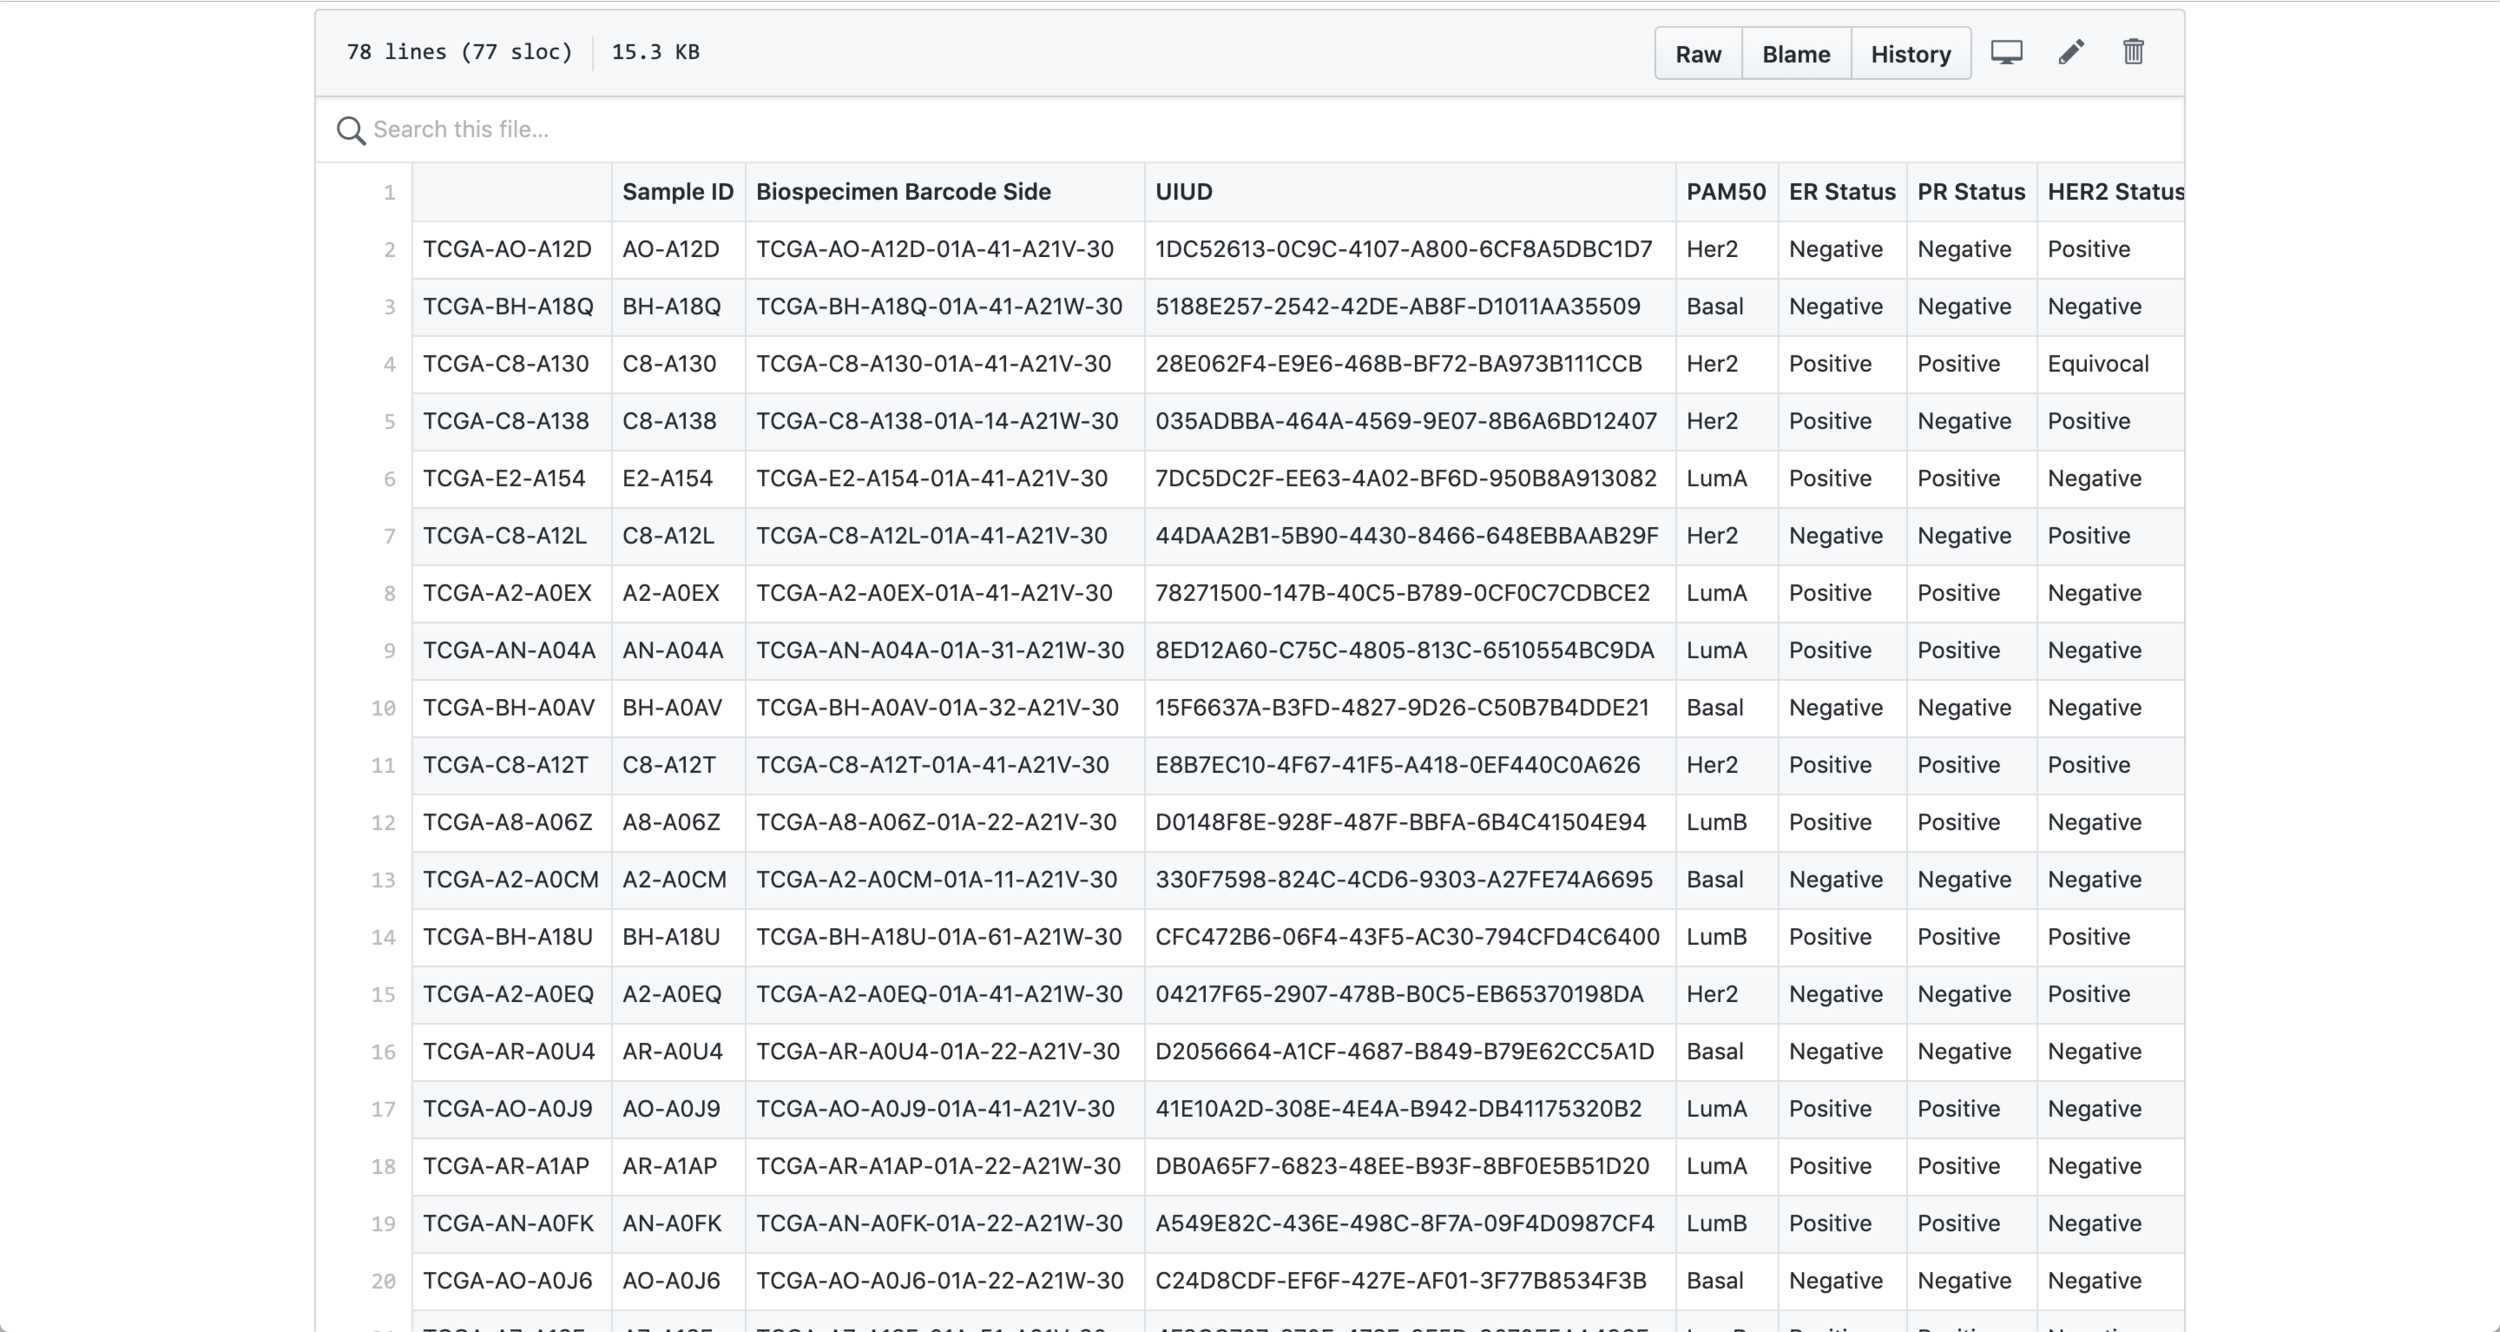
I started my process with a csv file containing information about BRCA Tumors (breast cancer). Probably the biggest challenge from this assignment was to be able to filter the data and select the columns that I assumed were going to be more interesting to visualize. After selecting the data, I had to do a big amount of research in order to be able to understand what each data point meant. From id to receptors all the way to mutations, I had to make sure that I at least understood the data that I was trying to visualize in order to generate something that made sense for the researchers.

When I decided on which data points to visualize and I was able to have a basic understanding of it I transformed the .csv file into a .json file in order to be able to work with it with Object Oriented Programming.

Data in json file

Data in json file

The sketching process was crucial in order to quickly iterate and find different visual proposals that would add value to the graph. I decided to visualize each tumor in a vertical line containing all the information related to it inside a rectangle. Showing the tumor type, the receptors, the ion and the mutations in a clear way was the goal for this part of the process therefore I had to test different ways to structure and visualize the data.

Understanding the data

Understanding the data

Sketching process

Sketching process

The visual design was very important for me because I wanted to make sure that I could create a visualization with enough legibility for the researchers, therefore the visual display of the elements and the color palette were crucial in order to ensure legibility and enough differentiation between all the data points and the different groups of data points (ions, mutations, receptors and type of tumor). The visual separation between the 4 sub-groups of data was intended to help the user read the information in a better way and using colors for only two and defining the other two (ions and receptors) in gray by only using the occupied space as an indicator helped me to visually separate the block of sub-data.

Visual design and color palette

Visual design and color palette

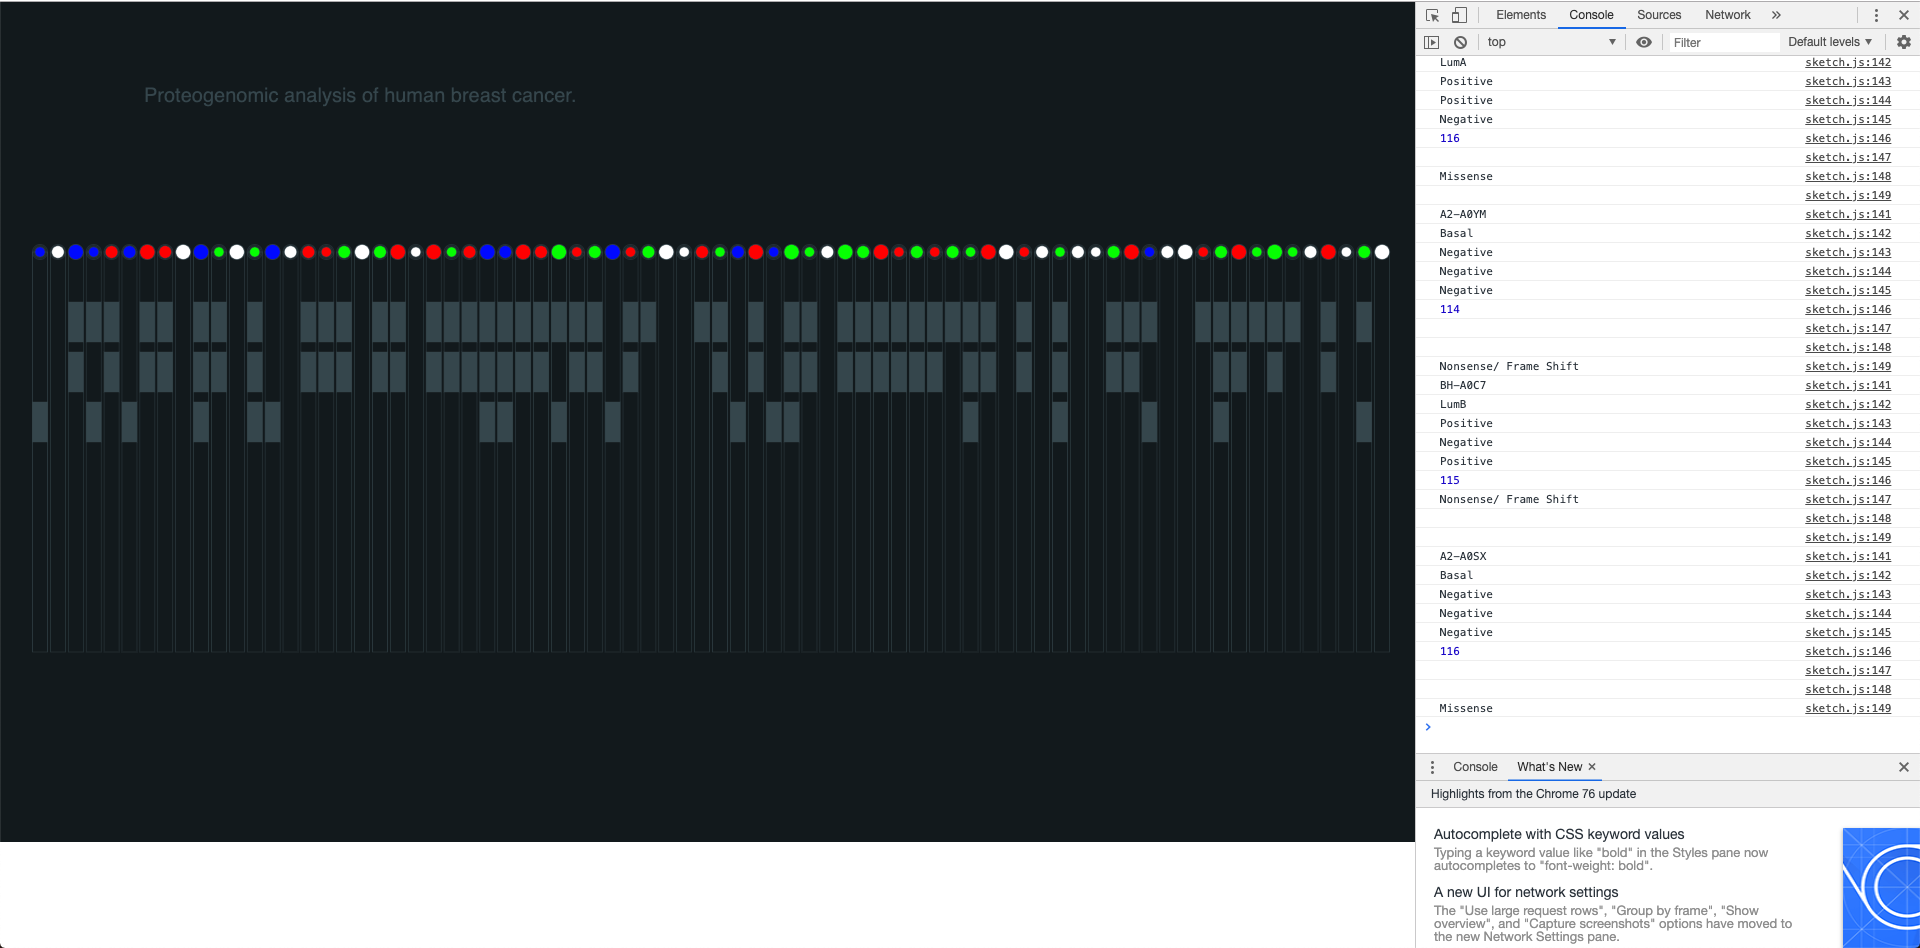
The coding process started by being able to generate an Object Oriented sketch, I wanted each tumor to be an object to be able to easily reference to it later on and extract all the data points for each one of them. I decided to visualize all the vertical rectangles (tumors) in the entire width of the screen in order to provide a way for the researcher to compare the data points next to each other.

I was able to generate a visualization that (although might not be a very efficient way of coding) is connected to the real data and shows interesting correlations between different data points and their sub-groups.

Coding Process
Coding Process

Coding Process

The final result is a graph that can be viewed in the browser, which is connected to a .json file and uses p5.js in order to display the data in the canvas.

Final Visualization