For my final project of Quantified Humanists I wanted to collect, analyze and visualize data related to triggers of my emotional misbalance during the semester, I started by trying to quantify the quality of my meals, the exercise that I did and the guilt that I felt every time that I ate something unhealthy or I didn’t exercise.
At the very beginning of the project I realized that I wasn’t actually interested in counting how many days did I exercise or how healthy my meals were, instead I was interested in the emotional impact that those moments had in me. Thinking about how I felt every time that I did something “wrong” I realized the Guilt was the common denominator in all of those moments. I started to get interested in understanding why did I feel guilt, how much guilt did I feel and what triggered that guilt. The ultimate goal of that collection was to identify events that have a negative impact in my mental health and being able to mitigate them by finding ways to better deal with my everyday moments of guilt.
The project started with the data collection, in order to have a way to collect that was easy to implement and maintain over time, I created a Google doc, and I installed a shortcut in the home screen of my phone so that I would have easy access to it.
After I finished the data collection process, the Google Form provided me with a preview of the data visualized in a traditional way, I realized immediately that these visualizations were not able to give the the knowledge that I was seeking since they sere individual data points instead of being correlations of information.
I downloaded the data in a .csv file and converted it to a .son so that I could use it as an input to create different graphics using p5.js. The conversion process was important for me to be able to have a well structured data file with all the information collected.
The first step of the design process was to sketch different ways in which the data could be visualized. Depending on the type of data and the correlations that I wanted to make (for example, trigger vs level of guilt) I created different ways of visualizing the data by using alternative graphics, different than just bar-charts or scatter plots.
After I decided which graphics to create and how to better visualize and correlate the information I started the development process in p5.js. I also created a in Sketch in which I defined the typography and the colors that I wanted to use in the sketch.
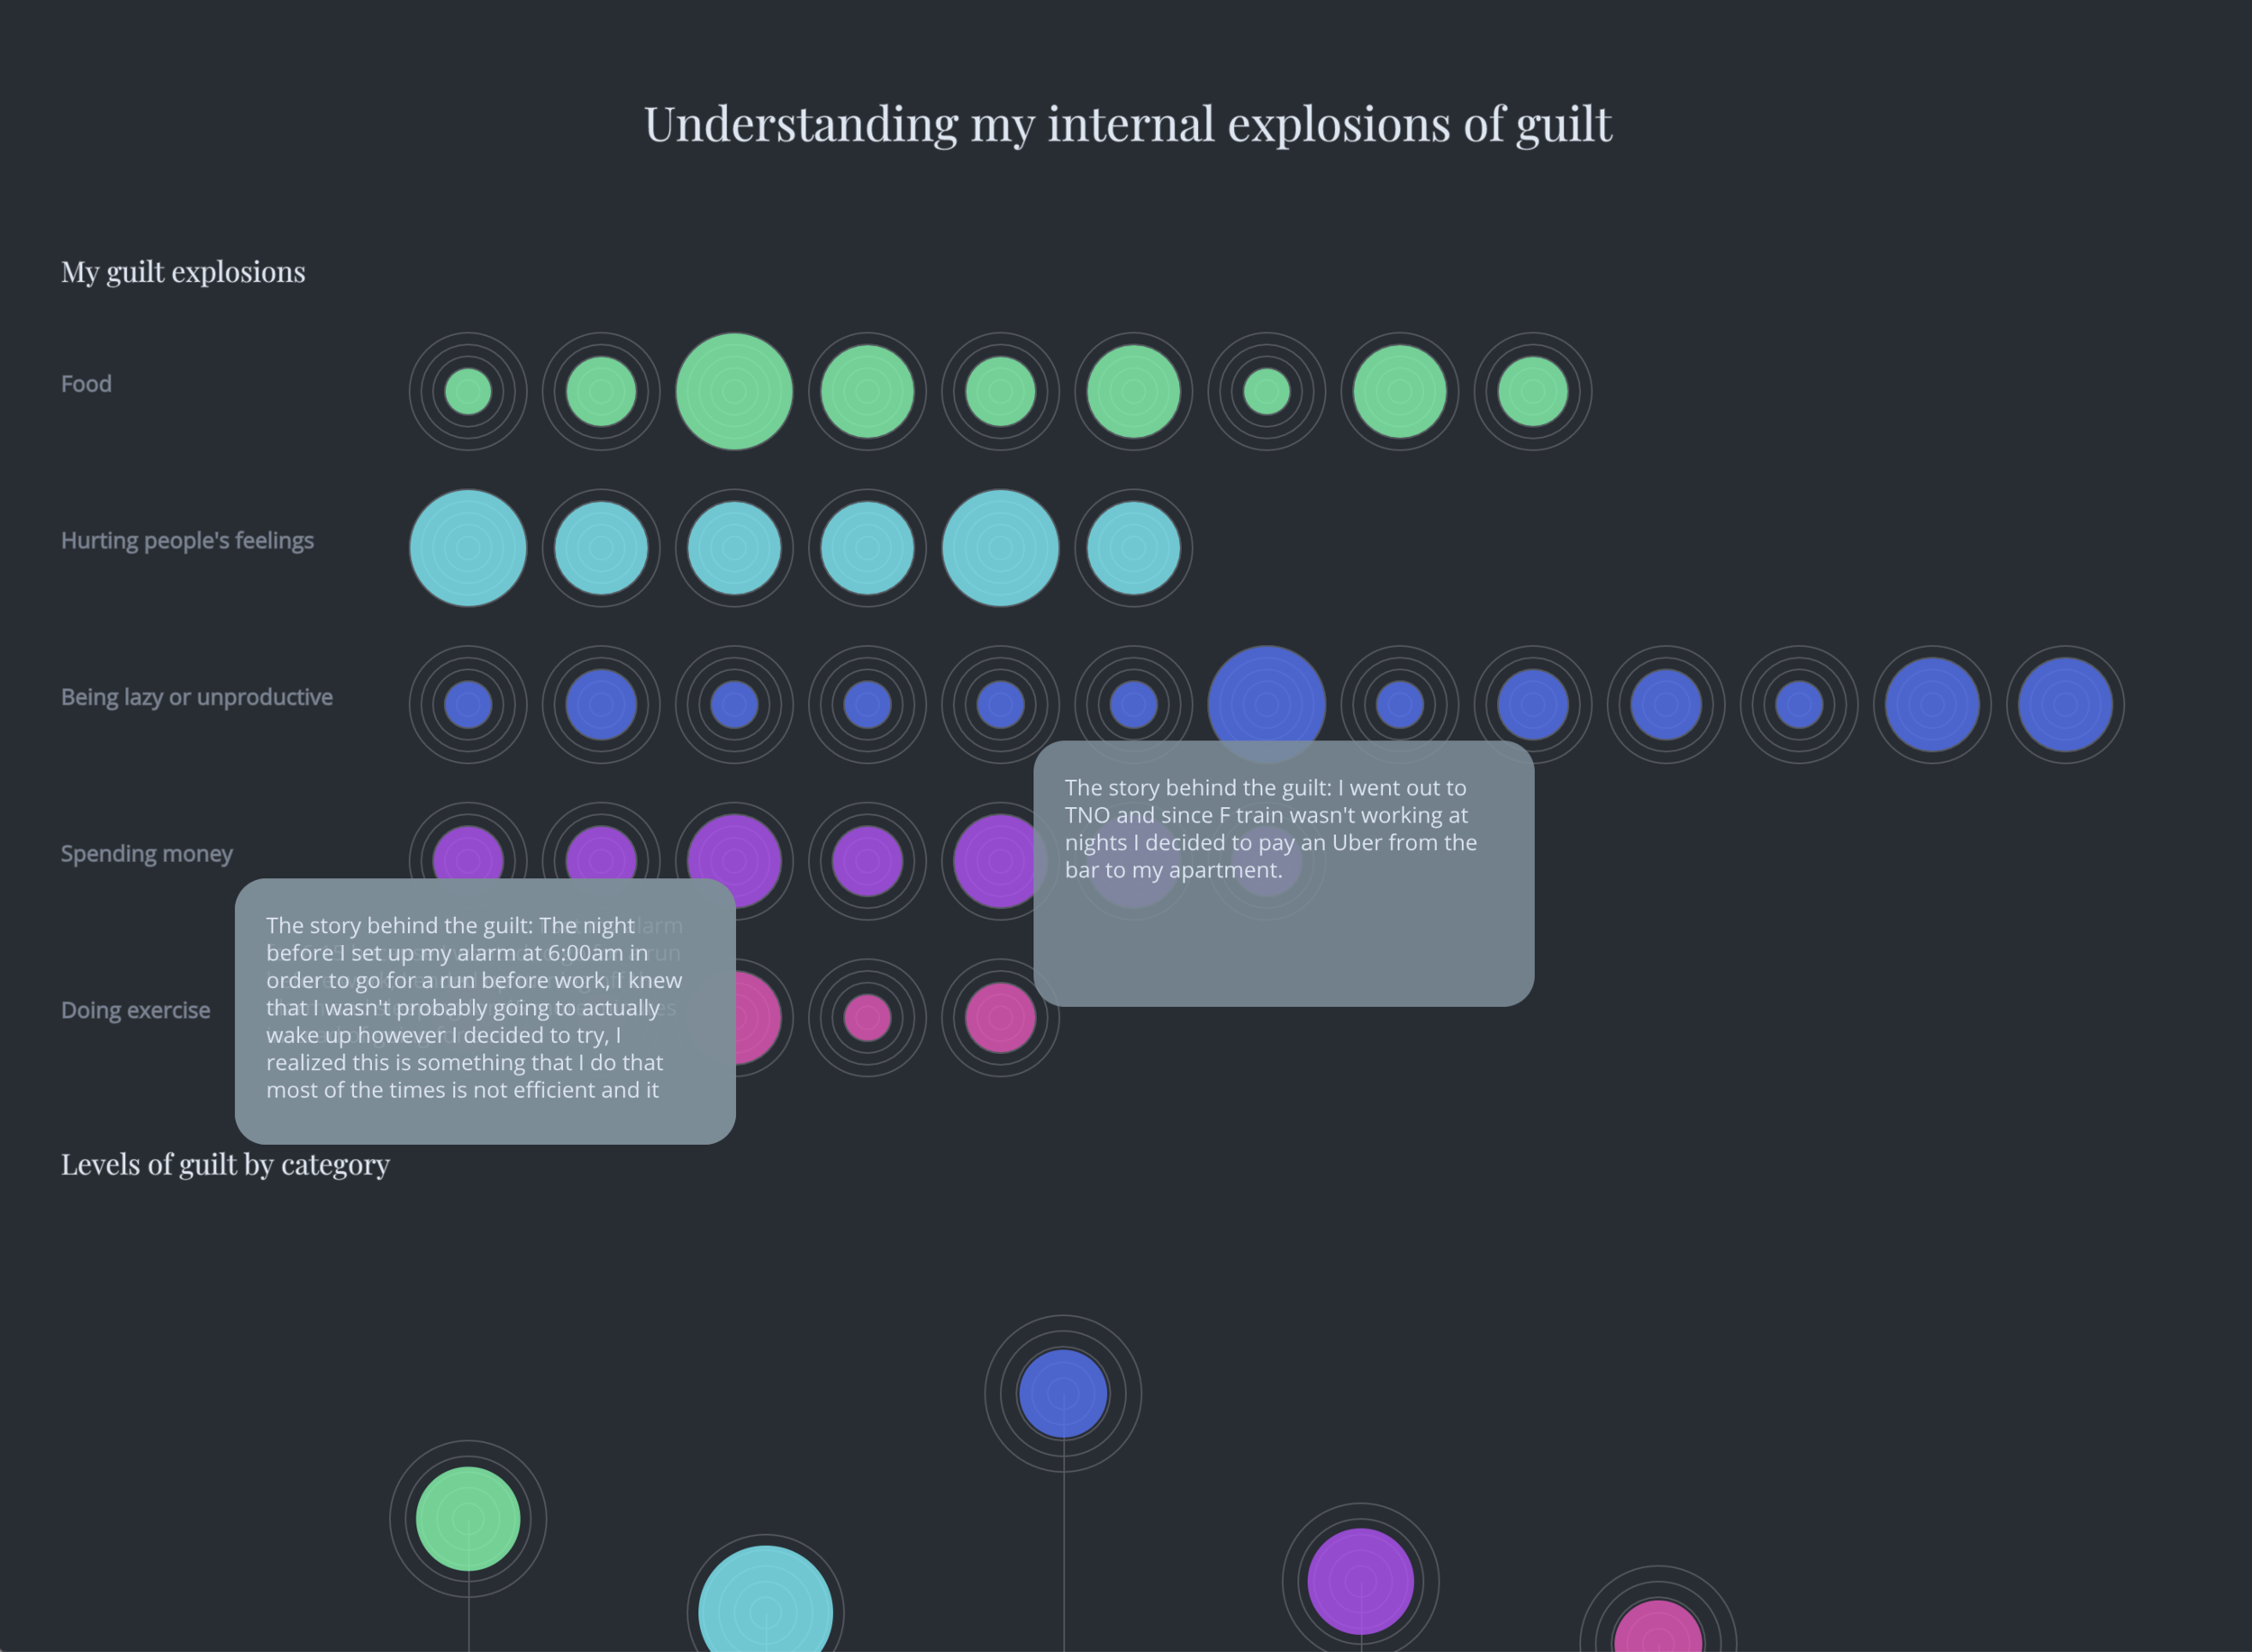
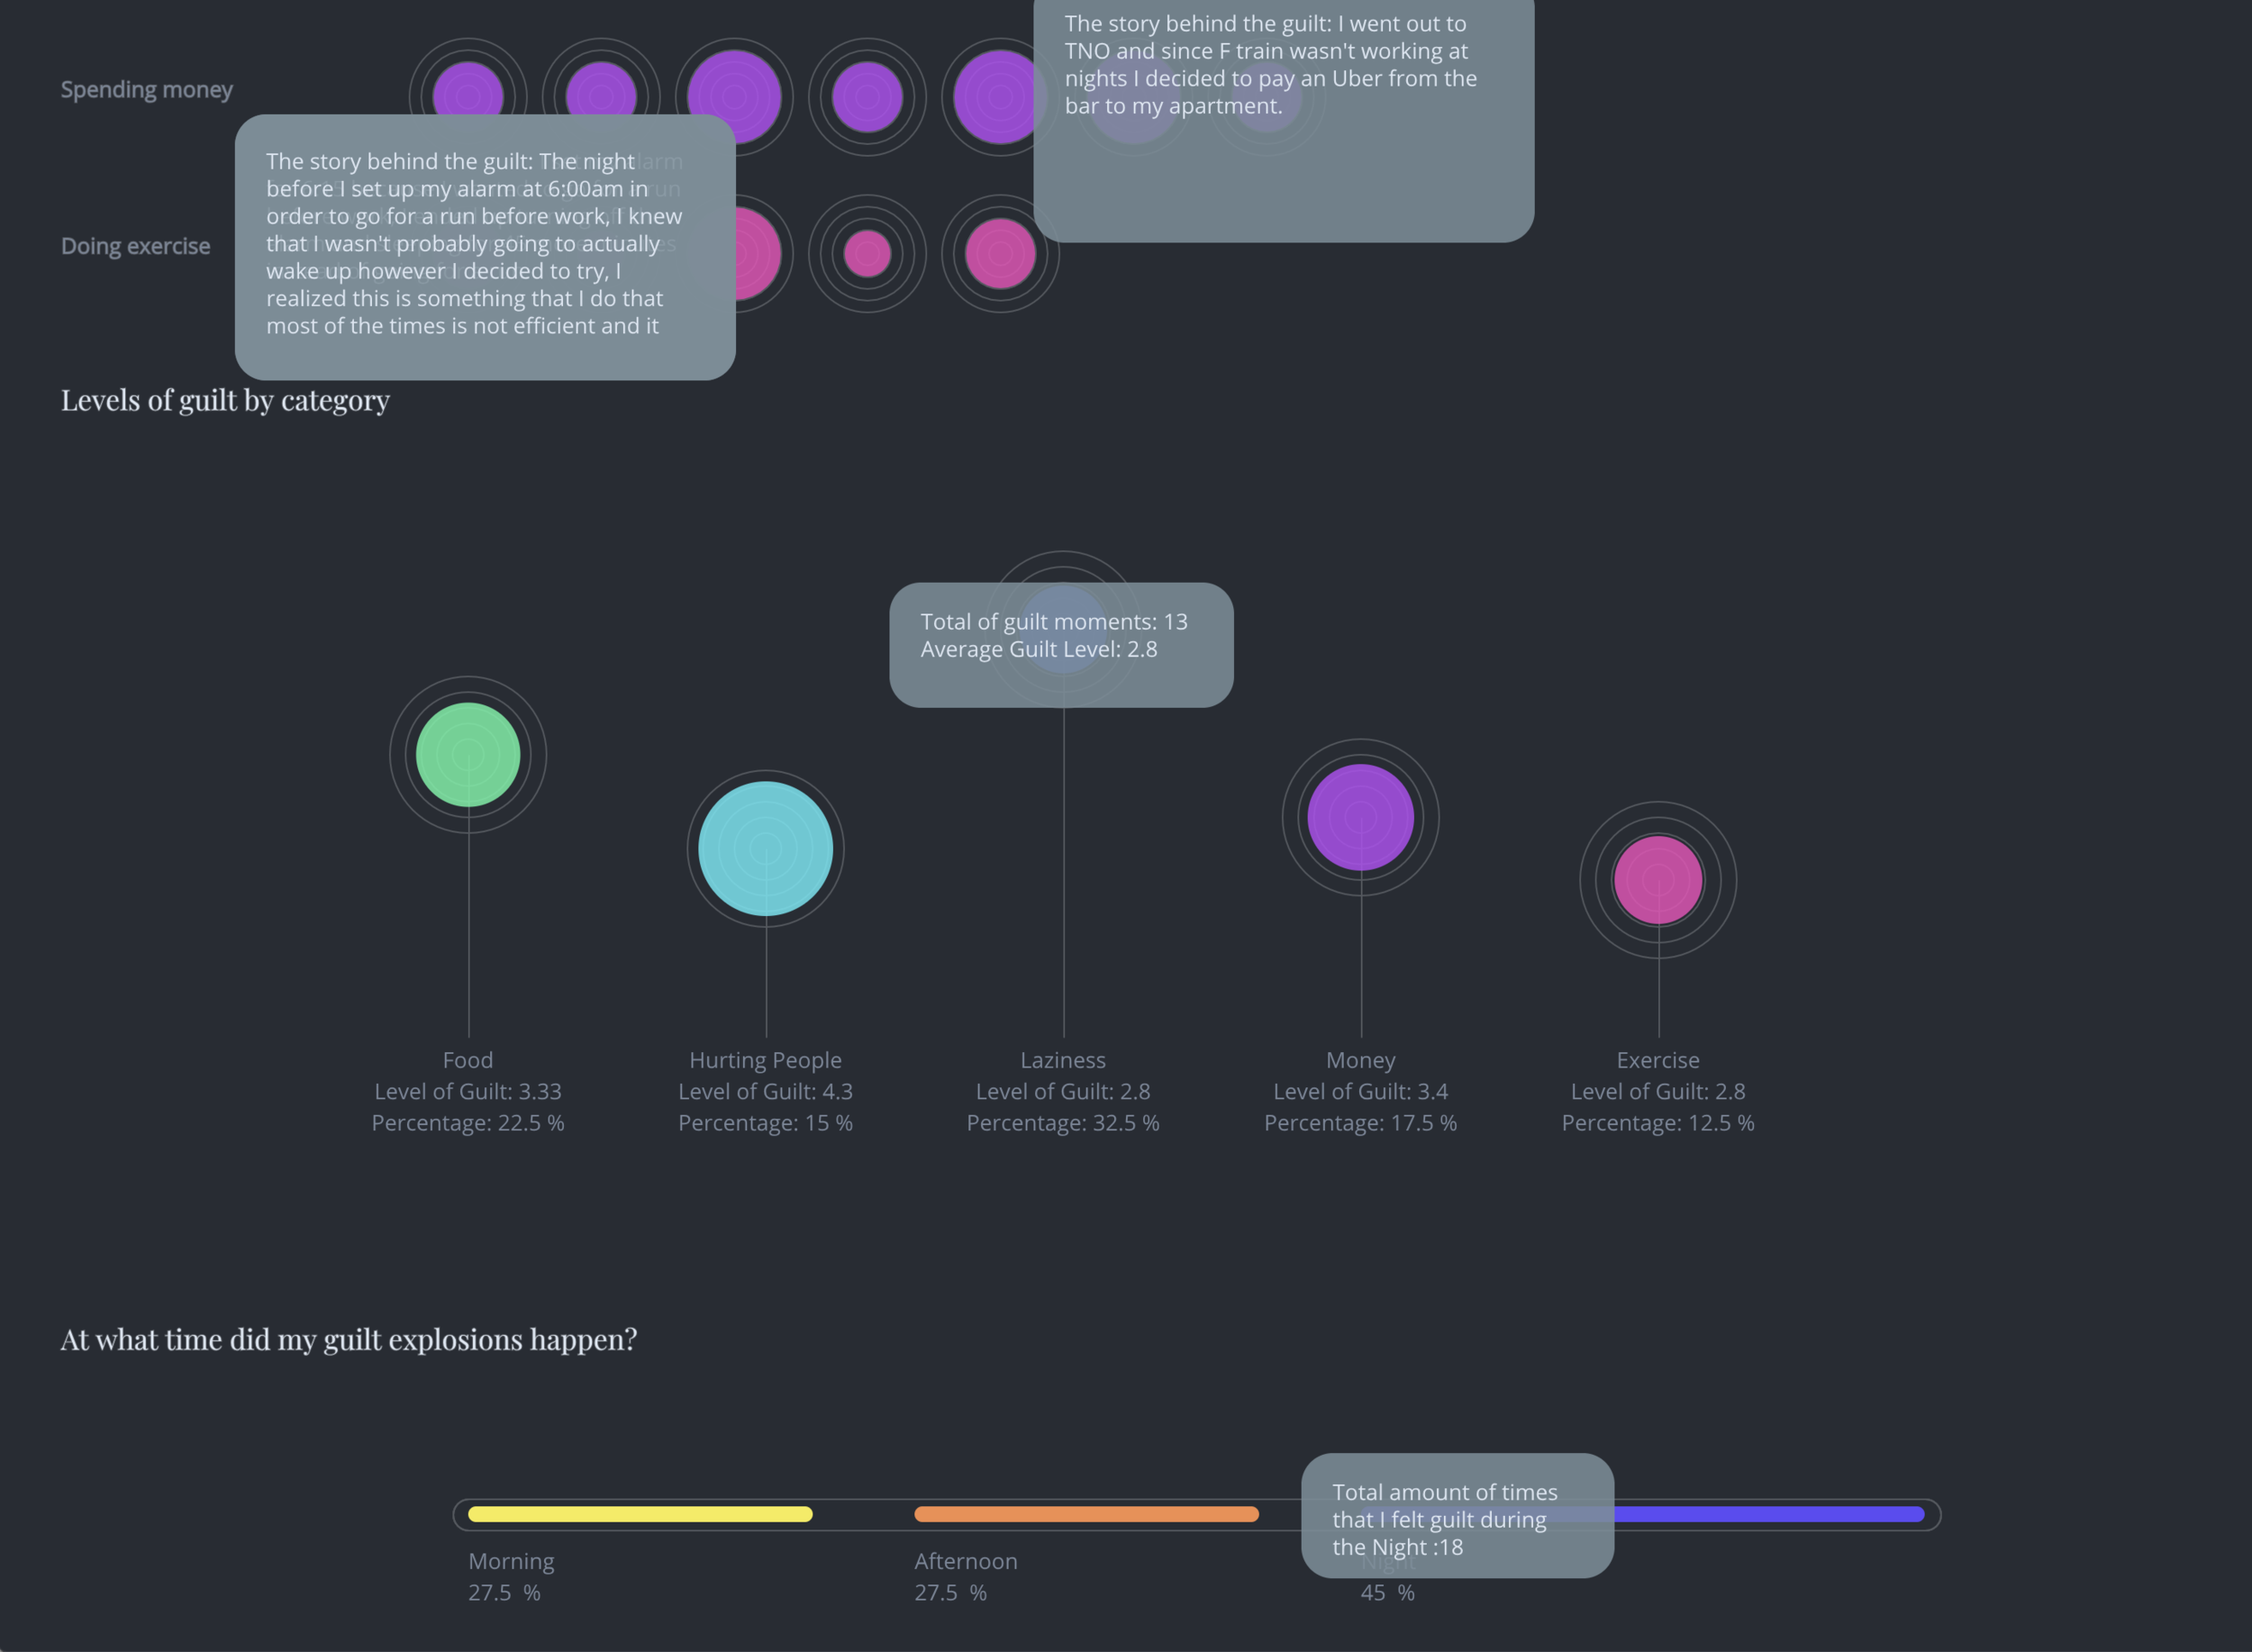
The final data visualization consists on three different charts and each one of them communicates a specific correlation of the previously collected information. The first chart shows all the individual moments of guilt (40 in total) and the strength (in a scale from 1 to 5) that I felt. I also used different colors to differentiate from each different trigger reason. The second chart shows an average of all the guilt moments by category and the strength to show how different those data points were between different triggers. Finally the third graphic shows the total amount and percentage of moments of guilt by time of the day, in general it is easier to understand that I normally feel more guilty during the night.
I hope that this exploration of my feelings is going to help me prevent from having unjustified moments of guilt and hopefully be able to decrease the moments of guilt that I experience during the day and the negative effects in my mental health.


