Intel Smart City Manager
Intel requested Volteo to build an interactive dashboard to communicate the 5g capabilities such as enabling greater public safety, improved citizen services, and real-time monitoring of crowds, traffic, and the environment.
Volteo in the MWC Barcelona 2018
The problem
The 5G technology was the core of the MWC Barcelona 2018 however one of the biggest challenges was to be able to communicate to the conference attendees what this technology actually means for a city and how this can improve peoples lives.
Data collection has been happening for many years but there was a lack of clarity in the way that this information was being presented. The potential of monitoring the air pollution, the temperature and even specific events such as an Amber Alert for when a child is missing or Safety Emergencies needed to be communicated in an intuitive way so that the users could understand the huge possibilities that the 5G technology entails.
Coming up with a solution
The design process started with multiple meetings with the customer in which it was crucial to understand the user interaction that was going to happen during the conference. Since it was a big event with a lot of rotating attendees we knew that we had to develop a solution that was easy to understand because the users would spend a limited amount of time in the booth and in front of the screens.
The next phase was to understand the data. Volteo’s team worked with real data (from a different city than Barcelona) that was being collected by different sensors. The goal was to be able to overlap the real data un a fake scenario (in this case the map of Barcelona). All the data points that were being collected corresponded to different paradigms of visualization therefore the Wireframing and User Testing process was vital for the team to decide which designs worked better in order to communicate the 5G technology.


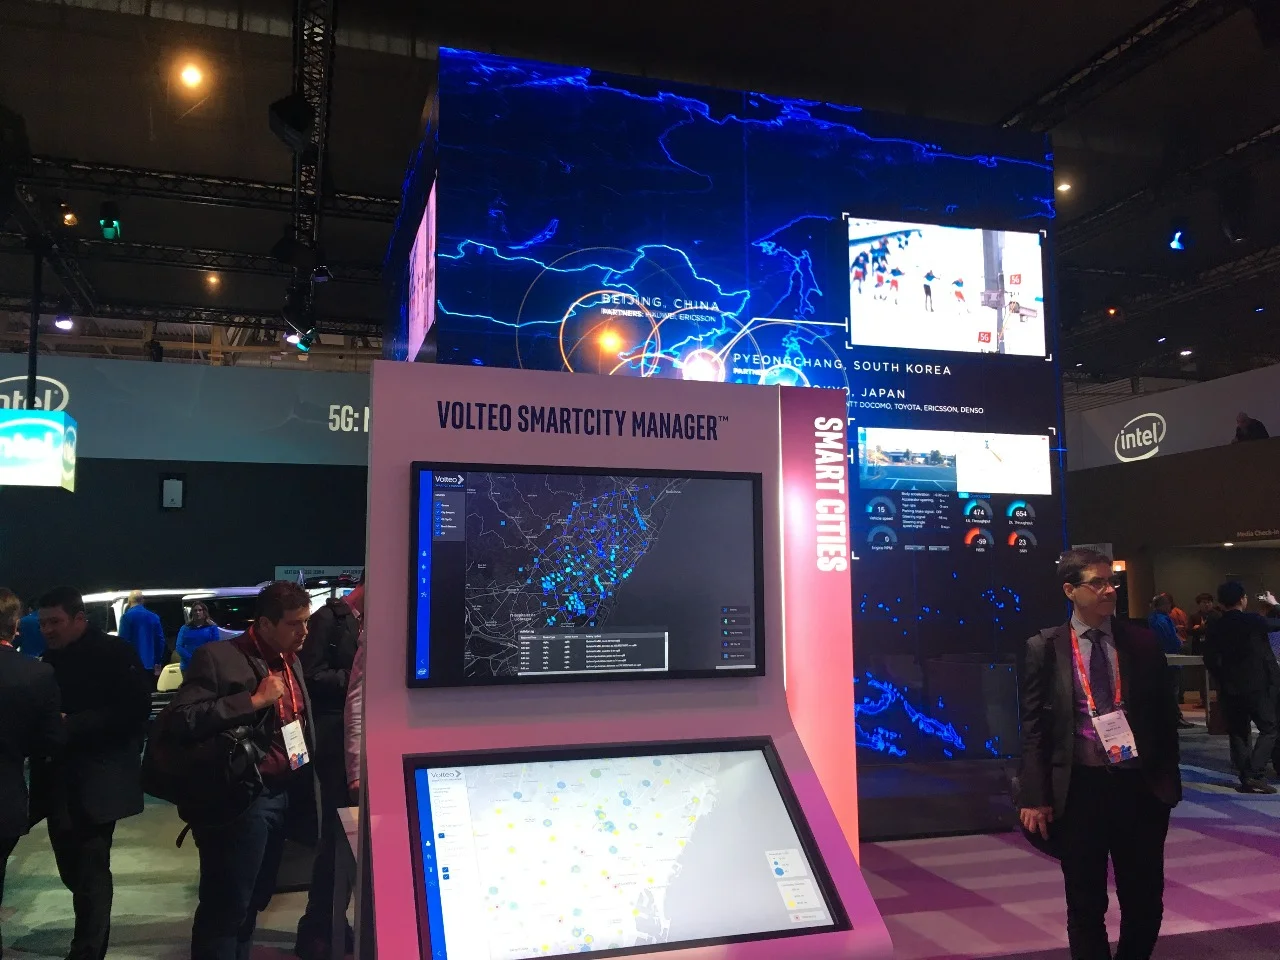
The design concept consisted in two different parts, the “light” layout to show the events that were happening on the surface and the “dark” layout to show the 5G technology and sensors involved to get the data in real time. I decided to create a toggle button on the top in order to allow the user the possibility to switch between the two different layouts. This decision was discarded after presenting the InVision prototype to the customer because we decided to have two different screens in the conference, one with the light layout and one with the dark so that the users could see both information and the relationship between them simultaneously.
My role
My Role started from the requirements gathering with the client, I continued with the ideation and information visualization process, I also developed and validated the Wireframes with an InVision prototype and lastly I generated the final design, exported the assets and coordinated and supervised the product usability with the developer.
The Volteo team work remotely from Costa Rica and collaborating with Data Engineers located in Arizona, it was very challenging to establish a good way to work as a team however we managed to overcome those obstacles and that made it possible to complete this project in a very tight schedule and delivering a very good result to the customer.


The result
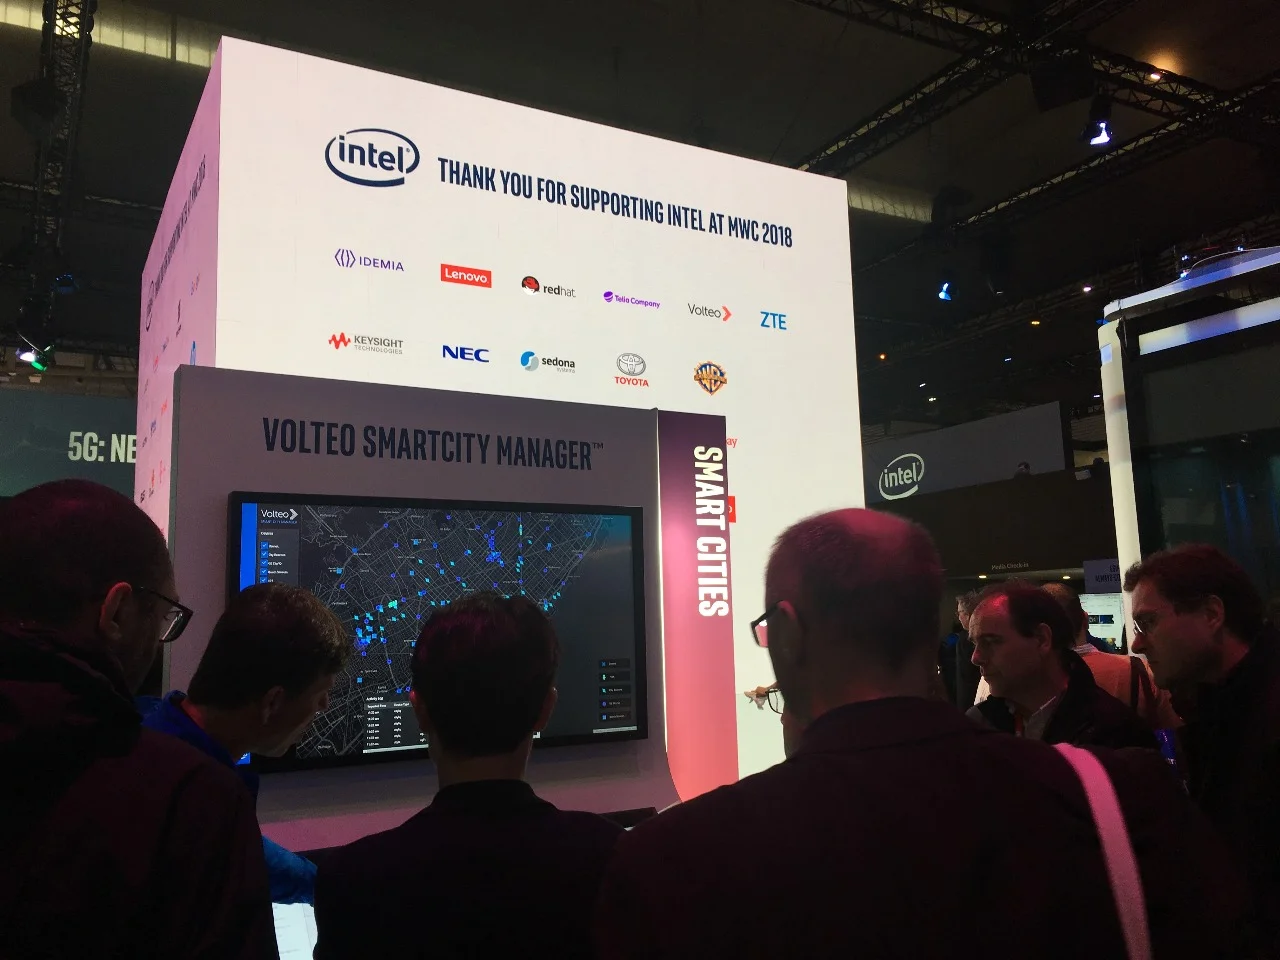
The final result is was an interactive data visualization dashboard that represents the 5G capabilities from Intel. The project was successfully presented at Intel’s booth during the Mobile World Congress (MWC) Barcelona 2018 where it received very good feedback from both the customer and the conference attendees.
This project was developed by the Volteo team in Costa Rica and Arizona and I was in charge of the Information Visualization as weel as the UX and UI phases of the project.
Copyright:
Intel | Volteo
Developer Carlos Cruz Castillo.